EUR/USD looks higher on Monday but technical ceiling remains

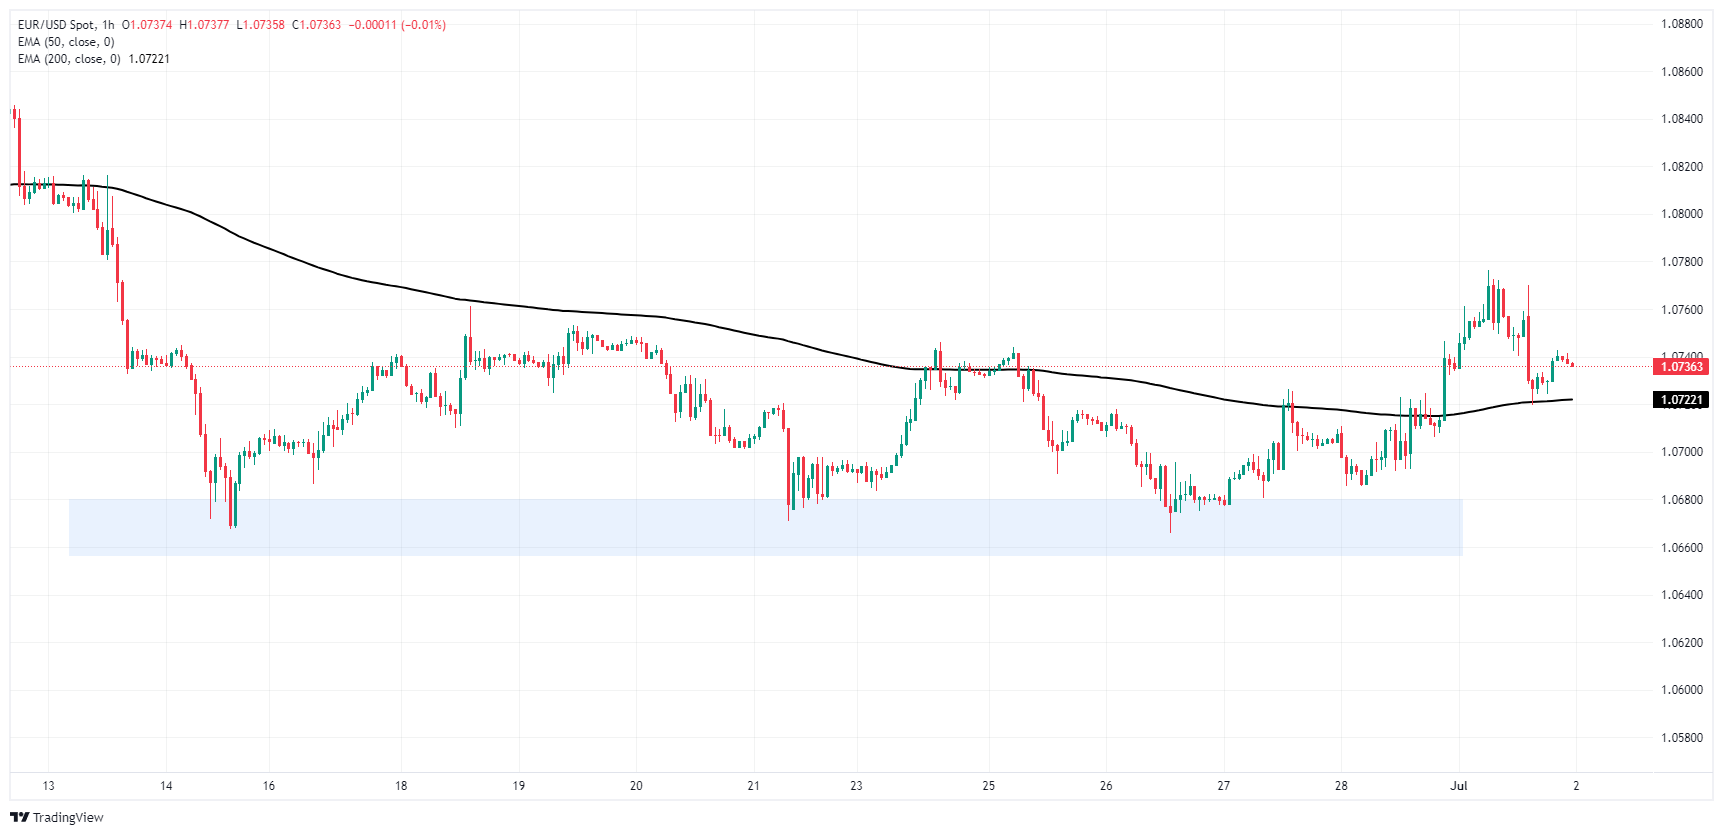
- EUR/USD briefly tested above 1.0770 on Monday before settling back.
- A packed economic data docket awaits the Fiber this week.
- EU HICP inflation, US NFP data looms ahead.
EUR/USD clipped into a fresh multi-week high above 1.0770 on Monday before getting forced back down by a broad-market reversal in investor sentiment. Bullish momentum was cut short after US activity figures flashed warning signs of a steepening economic downturn. Investors will be buckling down for the wait to key economic figures on both sides of the Atlantic throughout the week, culminating in a fresh print of US Nonfarm Payrolls (NFP) slated for Friday.
Forex Today: All the attention shifts to Powell and Lagarde
German Consumer Price Index (CPI) figures broadly missed the mark early Monday, with annualized German CPI easing to 2.2% in June, falling from the previous 2.4% and backsliding through the forecast 2.3%. US data also missed expectations on Monday; US ISM Manufacturing Purchasing Manager Index (PMI) figures declined in June, falling to 48.5 from 48.7 and entirely missing the forecast increase to 49.1. US ISM Manufacturing Prices Paid also declined sharply in June, falling to 52.1 from the previous 57.0, falling even further beyond the forecast decline to 55.9.
Economic Indicator
ISM Manufacturing PMI
The Institute for Supply Management (ISM) Manufacturing Purchasing Managers Index (PMI), released on a monthly basis, is a leading indicator gauging business activity in the US manufacturing sector. The indicator is obtained from a survey of manufacturing supply executives based on information they have collected within their respective organizations. Survey responses reflect the change, if any, in the current month compared to the previous month. A reading above 50 indicates that the manufacturing economy is generally expanding, a bullish sign for the US Dollar (USD). A reading below 50 signals that factory activity is generally declining, which is seen as bearish for USD.
Last release: Mon Jul 01, 2024 14:00
Frequency: Monthly
Actual: 48.5
Consensus: 49.1
Previous: 48.7
Source: Institute for Supply Management
Why it matters to traders?
The Institute for Supply Management’s (ISM) Manufacturing Purchasing Managers Index (PMI) provides a reliable outlook on the state of the US manufacturing sector. A reading above 50 suggests that the business activity expanded during the survey period and vice versa. PMIs are considered to be leading indicators and could signal a shift in the economic cycle. Stronger-than-expected prints usually have a positive impact on the USD. In addition to the headline PMI, the Employment Index and the Prices Paid Index numbers are watched closely as they shine a light on the labour market and inflation.
US markets were abruptly jolted into fresh risk concerns over the upcoming November presidential election. A recent public debate left the waters murky on who the clear frontrunner would be, and the US Supreme Court released a ruling on Monday stating that courts have limited capacity to levy criminal charges against sitting Presidents.
A fresh batch of key European data will drop on markets on Tuesday, with a slate of speeches from European Central Bank (ECB) policymakers including another appearance from ECB President Christine Lagarde. Pan-European Harmonized Index of Consumer Prices (HICP) inflation is expected to tick down slightly, with Core EU HICP inflation forecast to tick down to 2.8% YoY from the previous 2.9%. European Producer Price Index (PPI) inflation data is due Wednesday, followed by EU-wide Retail Sales figures early Friday.
On the US side, investors will be looking ahead to Tuesday’s appearance from Federal Reserve (Fed) Chairman Jerome Powell, followed by ADP Employment Change figures on Wednesday and Friday’s latest iteration of US Nonfarm Payrolls (NFP) and Average Hourly Earnings for June.
Euro PRICE This week
The table below shows the percentage change of Euro (EUR) against listed major currencies this week. Euro was the strongest against the New Zealand Dollar.
| USD | EUR | GBP | JPY | CAD | AUD | NZD | CHF |
|---|---|---|---|---|---|---|---|---|
USD |
| 0.04% | 0.03% | -0.02% | 0.02% | 0.09% | 0.16% | 0.06% |
EUR | -0.04% |
| -0.01% | -0.05% | -0.02% | 0.06% | 0.11% | 0.02% |
GBP | -0.03% | 0.00% |
| -0.04% | -0.00% | 0.04% | 0.11% | 0.02% |
JPY | 0.02% | 0.05% | 0.04% |
| 0.03% | 0.13% | 0.15% | 0.07% |
CAD | -0.02% | 0.02% | 0.00% | -0.03% |
| 0.08% | 0.13% | 0.04% |
AUD | -0.09% | -0.06% | -0.04% | -0.13% | -0.08% |
| 0.05% | -0.04% |
NZD | -0.16% | -0.11% | -0.11% | -0.15% | -0.13% | -0.05% |
| -0.09% |
CHF | -0.06% | -0.02% | -0.02% | -0.07% | -0.04% | 0.04% | 0.09% |
|
The heat map shows percentage changes of major currencies against each other. The base currency is picked from the left column, while the quote currency is picked from the top row. For example, if you pick the Euro from the left column and move along the horizontal line to the US Dollar, the percentage change displayed in the box will represent EUR (base)/USD (quote).
EUR/USD technical outlook
The Fiber kicked off the new trading week with a fresh push into 12-day peaks above 1.0770 before crumpling risk appetite dragged the pair back down to 1.0735. Intraday price action continues to lean into the midrange as EUR/USD grapples with the 200-hour Exponential Moving Average (EMA) at 1.0722.
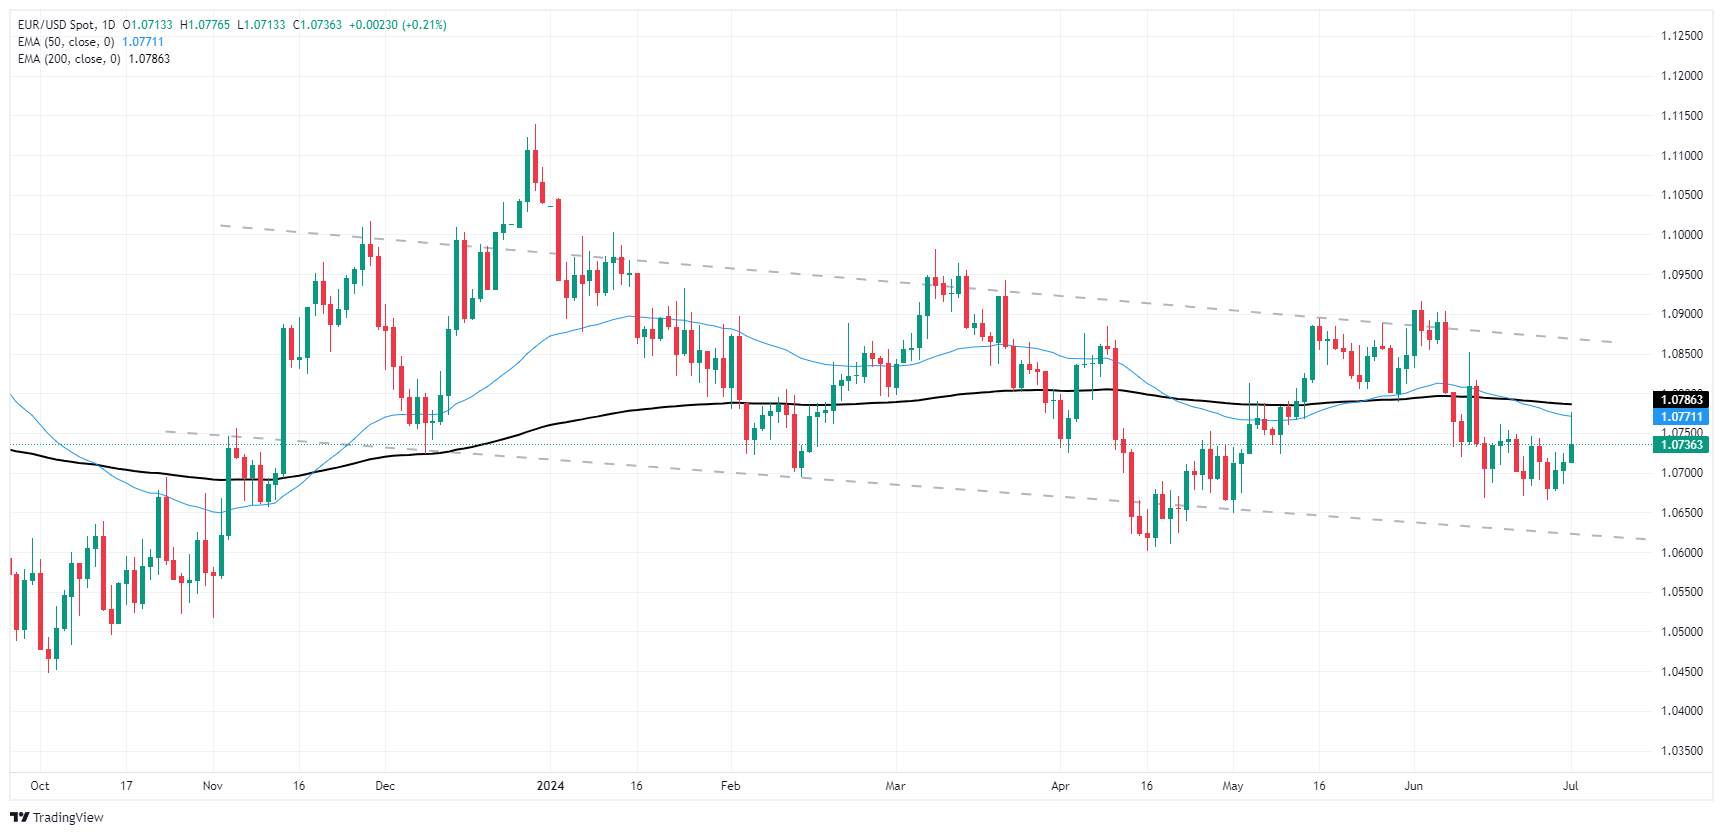
EUR/USD found technical support from a demand zone priced in below 1.0680, but bullish momentum remains limited as technical indicators weigh bids down. Daily candlesticks remain pinned below the 200-day EMA at 1.0786, and Fiber remains trapped on the low end of a recent decline from June’s early bids above 1.0900.
EUR/USD hourly chart

EUR/USD daily chart


