Japan: Believe in Long-Term Recovery. Buy!

Executive Summary
1. Background
1.1 Before 1991: Bubble Forming
In the early post-World War II period, the US supported Japan's economic recovery through loans and aid. During the Korean War (1950–1953), Japan's geographical proximity allowed its goods to be sold widely, enabling the country to overcome its postwar economic difficulties. This marked Japan's transition into the era of the "World Factory".
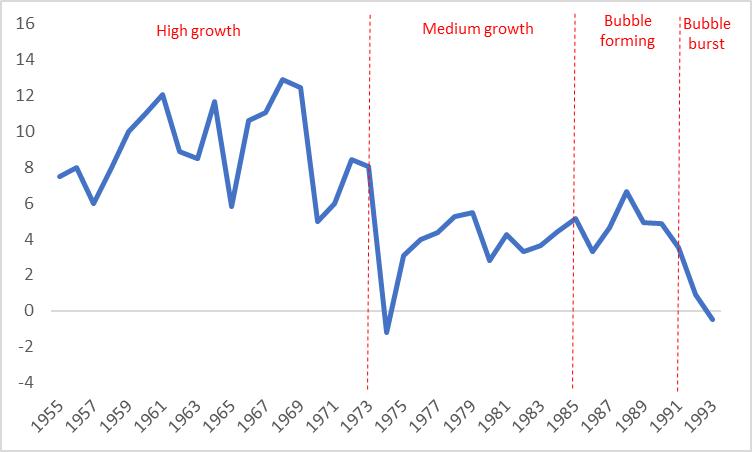
From 1955 to 1973, Japan experienced a period of rapid economic growth. During this time, Japan developed a "Zaibatsu System" centred around banks and interconnected other industries. This system played a pivotal role in Japan's economic development by improving efficiency, integrating resources and reducing excessive competition (Figure 1.1.1).
The 1973–1974 oil crisis triggered high inflation in Japan, leading to a sharp decline in consumption, investment and overall economic performance. However, this crisis also spurred Japan to begin transforming its economy from production-focused to technology-driven. From 1974 to 1985, Japanese companies gradually upgraded their technology and the economy entered a period of medium-speed growth.
The oil crisis also affected the US, causing stagflation characterized by high inflation and low growth. To combat inflation, the Fed initiated a cycle of interest rate hikes, leading to a significant appreciation of the US dollar. This, in turn, highlighted the good quality at a low price of Japanese goods, resulting in a substantial trade surplus for Japan with the US over many years.
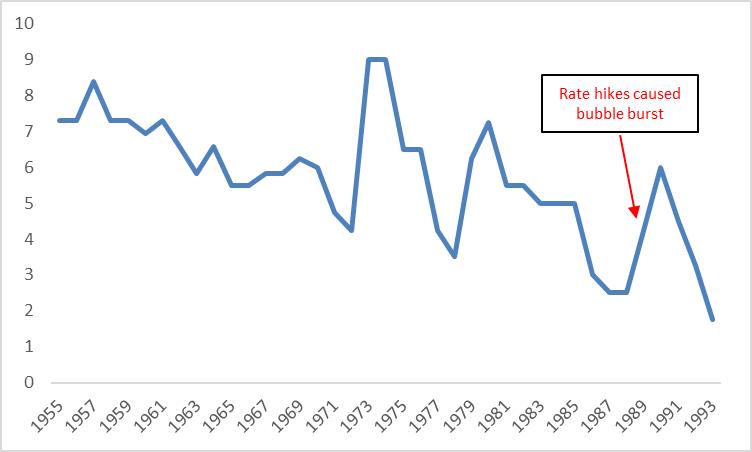
In 1985, the US launched a trade war against Japan, imposing higher tariffs on Japanese goods. In the same year, the US, Japan, France, the UK and Germany signed the Plaza Accord, agreeing to depreciate the US dollar by jointly selling the currency. As a result, the yen appreciated sharply against the dollar, hurting Japan’s exports and plunging the economy into crisis. To mitigate the economic impact and reduce unemployment, the Bank of Japan began cutting interest rates and then maintained them at a low level for an extended period.
The availability of cheap funds due to low interest rates fuelled speculation in the stock and real estate markets, creating significant asset bubbles. As housing prices soared to record levels, banks began lending extensively to companies and individuals with poor credit, resulting in what has been termed a Japanese version of subprime lending.
By 1989, rising inflation expectations, expanding asset bubbles and widening income inequality prompted the Bank of Japan to raise interest rates. This tightening of monetary policy culminated in the bursting of Japan’s economic bubble in 1991 (Figure 1.1.2).
Figure 1.1.1: Japan real GDP growth before 1990s (%)
Source: World Bank, Bank of Japan, Tradingkey.com
Figure 1.1.2: Bank of Japan policy rate (%)
Source: Refinitiv, Tradingkey.com
1.2 After 1991: Bubble Burst and Lost Decades
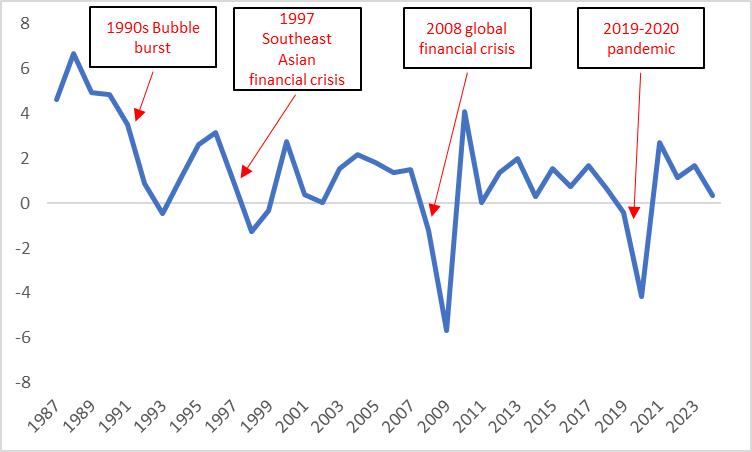
Since the bubble burst in 1991, the Japanese economy has experienced what is now referred to as the "Lost Decades" (Figure 1.2.1).
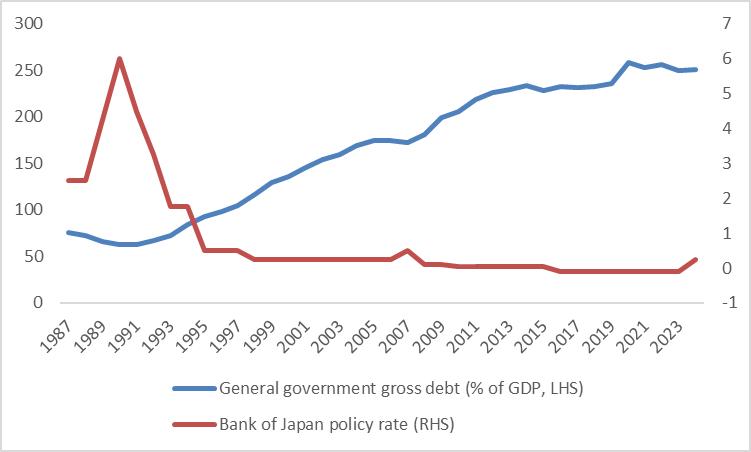
1991-1996: On the fiscal policy front, the Japanese government relied heavily on fiscal spending to stimulate the economy, but this led to Japan becoming the country with the highest debt-to-GDP ratio globally. On the monetary policy front, the Bank of Japan aggressively cut the policy interest rate from 6% in 1991 to 0.5% in 1995. Under the combined efforts of fiscal and monetary policies, the economy showed signs of recovery, albeit modestly.
1997-2007: The bursting of the stock and real estate bubbles since 1991 revealed deeper issues - a severe credit bubble crisis. In 1997, the Southeast Asian financial crisis exacerbated Japan's already fragile financial system, causing a contraction in loans and a declining money supply. Meanwhile, wages and prices entered a vicious downward cycle, worsening economic stagnation. With policy rates near zero, the Bank of Japan launched Quantitative Easing (QE), significantly expanding its balance sheet. Stimulated by policy measures and an improving global economy, the Japanese economy regained some momentum in the early 2000s.
2008-2019: The 2008 global financial crisis dealt a heavy blow to Japan's export-driven economy. Moreover, in the 2010s, competition from China and South Korea squeezed Japan’s export markets. The 2011 Fukushima nuclear disaster compounded economic challenges, necessitating additional government spending. Responding to those, Japan issued more government bonds and introduced QE2, an enhanced version of QE. In 2012, Prime Minister Shinzo Abe launched his "three arrows" strategy:
· First Arrow: Ultra-loose monetary policy, including negative interest rates and QQE (Quantitative and Qualitative Easing).
· Second Arrow: Flexible fiscal policies, such as corporate tax cuts and increased government spending.
· Third Arrow: Structural reforms, including promoting workforce participation among females, enhancing child care support, easing regulations and advancing trade liberalization.
After 2020: The pandemic in 2020 led to further escalation of Japan's fiscal and monetary policies, resulting in public debt and the central bank's balance sheet soaring to unprecedented levels (Figure 1.2.2).
Figure 1.2.1: Japan real GDP growth after 1990s (%)
Source: IMF, Tradingkey.com
Figure 1.2.2: Japan government debt and BoJ policy rate (%)
Source: Refinitiv, IMF, Tradingkey.com
2. Recent Macroeconomics
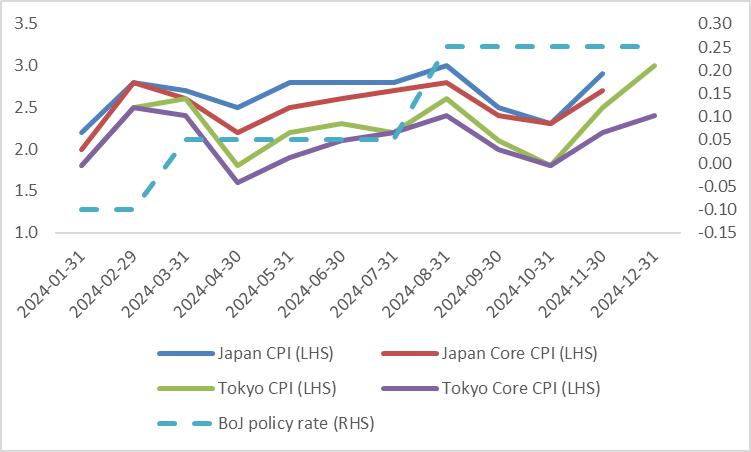
Under the long-term influence of the three arrows of Abenomics and the diminishing impact of the pandemic, Japan's economy has entered a recovery phase (excluding 2024). The emergence of inflation and a significant rise in wages, driven by the 2024 Shuntō wage negotiations, prompted the Bank of Japan to raise its policy rate from -0.1% to a range of 0%–0.1% in March 2024, followed by an increase to 0.25% in July. This move marked the end of seven years of negative interest rates. Simultaneously, the central bank also ended its Yield Curve Control (YCC) policy. Looking ahead, the Bank of Japan’s rate hike trajectory in 2025 will largely hinge on the performance of the domestic economy.
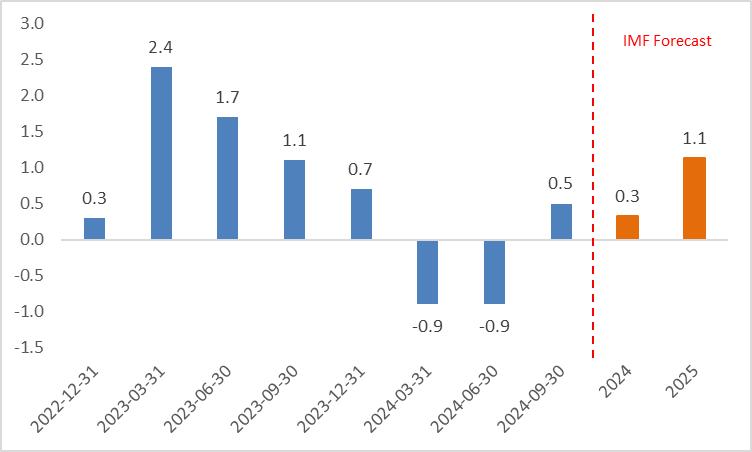
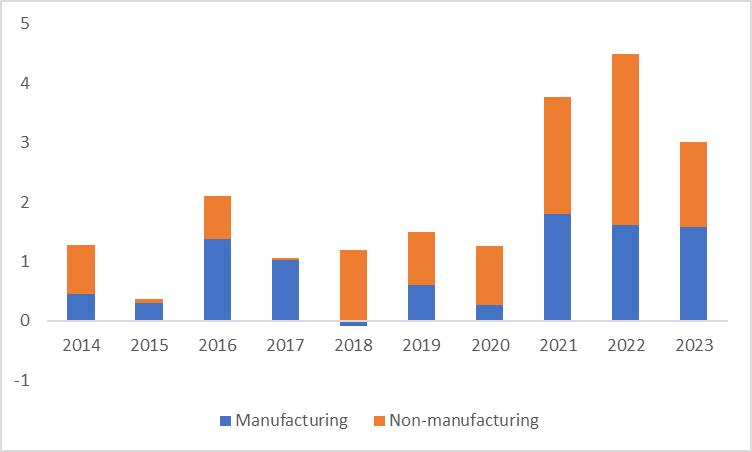
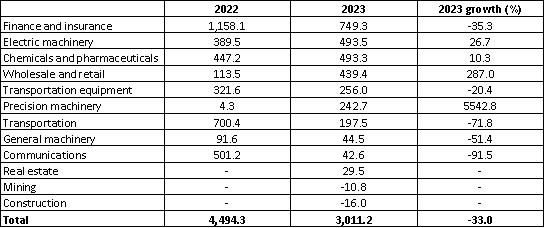
Recently, the Japanese economy has shown clear signs of recovery. In terms of growth, Japan’s real GDP growth turned positive in the third quarter of 2024. The IMF forecasts Japan’s economic growth to reach 1.1% in 2025, significantly higher than the 0.3% expected for 2024 (Figure 2.1). On the employment front, the unemployment rate has remained low for three consecutive years, while the continued increase in nominal wages has helped push real wages into positive territory after two years of negative growth. A robust labour market supports private-sector consumption. Additionally, signs of recovery are evident in retail, manufacturing, tourism and exports. As a result of the overall recovery of the Japanese economy in recent years, Japan's inward foreign direct investment (FDI) has also been on an upward trajectory (Figures 2.2 and 2.3). In terms of inflation, Japan’s CPI and core CPI (excluding fresh food), as well as Tokyo's CPI and core CPI as leading inflation indicators have all rebounded recently and are currently above the 2% target (Figure 2.4).
Given the combination of robust growth and elevated inflation, the Bank of Japan is expected to raise interest rates by 25bp on 24 January this year. If there is no rate hike in January, we anticipate that the Bank of Japan will raise rates once in March. Following that, the central bank is likely to implement two more rate hikes in the second half of the year, each by 25bp.
In the long run, although challenges such as an ageing population and high public debt may hinder economic growth, Japan has a strong foundation for long-term recovery. First, the structural reforms in finance, the labour market and corporate governance implemented in recent years will help Japan navigate future domestic and overseas challenges. Second, Japan boasts significant strength in high-end manufacturing industries, including automobiles, electronics and mechanical equipment, which provides a solid basis for stable long-term exports. Third, Japan has made substantial investments in high-tech fields such as robotics, semiconductors and green energy, with investment continuing to grow year by year. These technological advancements are a key driver of long-term economic development.
Figure 2.1: Japan's real GDP growth (y-o-y, %)
Source: Refinitiv, IMF, Tradingkey.com
Figure 2.2: Japan's inward FDI (Trillion yen)
Source: JETRO, Tradingkey.com
Figure 2.3: Japan's inward FDI by industry (Billion yen)
Source: JETRO, Tradingkey.com
Figure 2.4: Japan inflation and BoJ policy rate (%)
Source: Refinitiv, Tradingkey.com
3. Stocks
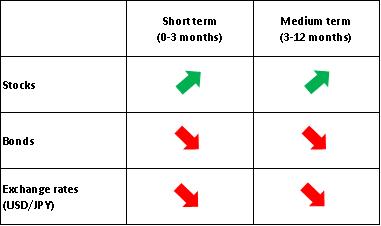
There is a saying in the global stock market: "If you believe in the power of science and technology, buy the US; if you believe in reform and opening up, buy Vietnam; if you believe in the demographic dividend, buy India; if you believe in long-term recovery, buy Japan." Given our optimism about Japanese economy in the short, medium and long term, our recommendation for Japanese stocks is to "buy".
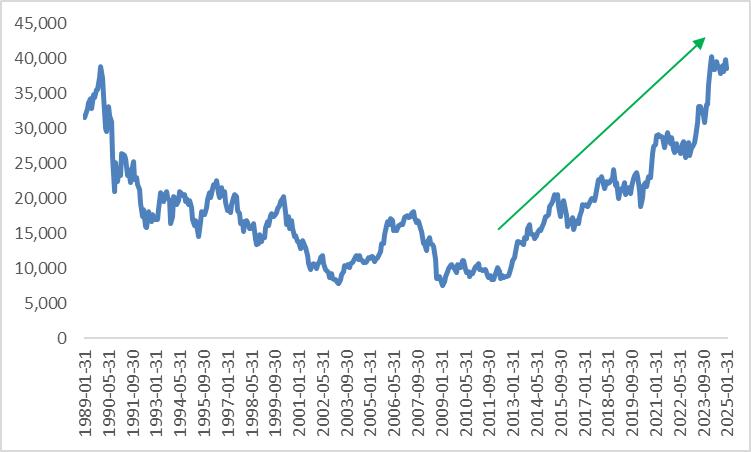
Since the end of 2012, the Japanese stock market has experienced a significant bull market (Figure 3). Looking ahead, in the short and medium term, several favourable factors—such as high growth, low unemployment and improving high-frequency data—are expected to support Japanese stocks. Additionally, corporate profits are likely to continue growing for three key reasons:
· Continued inflation, which supports revenue growth for companies;
· Real wage growth, which stimulates private sector consumption;
· Companies' ability to increase prices and pass on costs to consumers, improves profit margins.
The economic recovery and rising corporate profitability have strengthened stock prices on the numerator side. On the denominator side, the Bank of Japan's interest rate hike is not entirely negative for the stock market. Although higher rates may suppress the economy, reduce valuations and lead to a stronger yen, hurting exports, the positive effects include capital repatriation and benefits to the financial sector. In short, with favourable factors on the numerator side and mixed effects on the denominator side, we are bullish on Japanese stocks in the short and medium term.
After the bubble burst, Japan's stock market endured the "Lost Decades", largely due to a balance sheet recession. This occurs when, following an economic crisis, companies and households overpay their debts, leading to reduced willingness to consume and invest, which hinders economic growth and the stock market. To assess whether Japan’s stock market can thrive in the long term, one must consider whether Japan can fully escape this balance sheet recession.
Currently, with the recovery of capital expenditures in high-tech sectors such as semiconductor equipment and precision instruments, Japan’s high-tech companies are emerging from the balance sheet recession. However, there is no sign of recovery in the balance sheets of traditional industries and the household sector. As we are optimistic about Japan’s long-term economic outlook (which is analysed in detail in the recent macroeconomics section), we believe that over the next few years, various sectors in Japan will gradually overcome the balance sheet recession and long-term investment in Japanese stocks will prove to be a rational strategy.
Figure 3: Nikkei 225
Source: Refinitiv, Tradingkey.com
4. Bonds
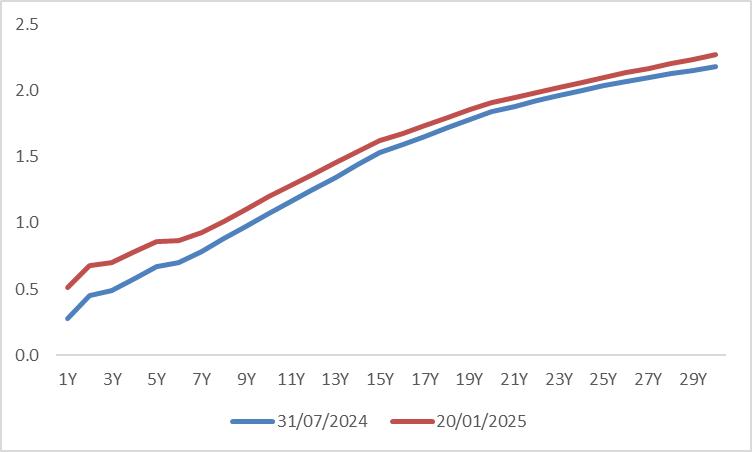
From the past two rate hikes, it can be seen that the entire Japanese government bond yield curve had room to rise after a policy rate increase, which aligns with economic principles. More specifically, after the 25bp hike on 20 February 2007, the government bond yields reached a peak after 4-5 months. Similarly, after the 10bp hike on 19 March 2024, the yields peaked after 2-3 months (Figure 4.1). Since the Bank of Japan raised the policy interest rate from 0%-0.1% to 0.25% on 31 July 2024, the government bond yields have continued to rise (Figure 4.2).
Looking ahead, if each rate hike continues triggering a 2-5 month rise in government bond yields, coupled with the expectation that the central bank will raise rates once in the first half of this year and twice in the second half, we remain bearish on Japanese bond prices in the short and medium term.
It’s worth noting that, unlike the rate hike in March 2024, this year’s rate hike cycle is expected to produce a greater rise in short-term (front-end) yields compared to long-term (back-end) yields, which flattens the Japanese yield curve. This is mainly due to expectations that insurance companies will significantly increase their holdings in domestic long-term bonds this year, putting downward pressure on long-term yields due to strong demand.
Figure 4.1: Impact of past Bank of Japan policy rate hikes on government bond yields

Source: Refinitiv, Tradingkey.com
Figure 4.2: Japanese government bond yield curve since last rate hike (%)
Source: Refinitiv, Tradingkey.com
5. Exchange Rates
For a long time, the Japanese yen has been regarded as a safe-haven currency. During periods of global economic turmoil—such as the subprime mortgage crisis, the European debt crisis and Brexit—the yen tended to appreciate, reflecting its safe-haven properties. The two main reasons for this are:
· The Bank of Japan (BoJ) has historically maintained negative interest rates. The large interest rate differential between the US and Japan made the yen a popular base currency for carry trades. When market risks increased, reverse carry trades drove the yen’s exchange rate up.
· Japan holds the largest net assets overseas. In times of global economic uncertainty, a significant amount of funds flowed back to Japan, which boosted demand for the yen, leading to its appreciation.
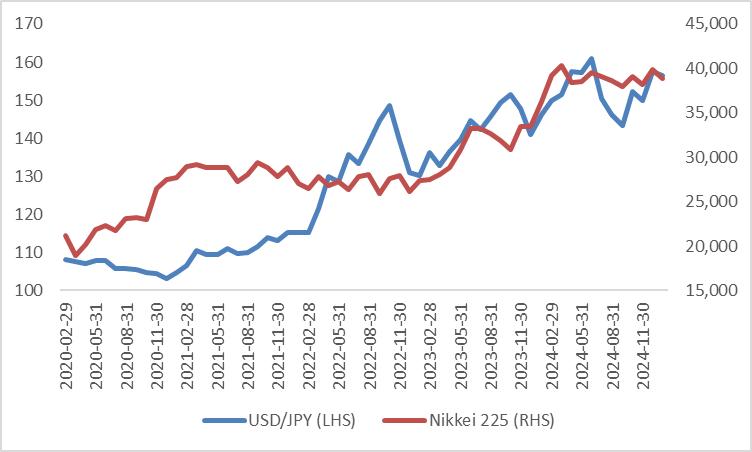
In contrast, the Japanese listed companies see a high proportion of profits from overseas, making stock prices positively tied to global economic conditions. Due to the yen’s safe-haven properties, Japanese stocks and the yen have historically exhibited an inverse relationship.
Looking ahead, we expect the yen’s safe-haven properties to gradually weaken for two reasons:
· The Bank of Japan has ended its era of negative interest rates and the path toward interest rate hikes this year is relatively clear. As the interest rate gap between the US and Japan shrinks, the yen carry trade is expected to diminish.
· With rising asset prices in Japan in recent years, valuations have increased. If a global financial crisis occurs, Japanese assets may experience sharp declines and the return of funds may not be as substantial as in the past.
Considering the economic and policy outlook, along with expected increases in Japanese bond yields, we believe the yen will strengthen. As the yen’s safe-haven properties weaken, the relationship between Japanese stocks and the yen may reverse from being inversely proportional to positive, at least in the short run. For overseas investors, this could present a unique opportunity to gain double benefits: rising stock prices and yen appreciation (Figure 5).
Figure 5: USD/JPY vs. Nikkei 225
Source: Refinitiv, Tradingkey.com


