

GBP/USD rallies past 1.3000 as China escalates trade-war with US

- China retaliates with 125% tariffs after US hikes duties to 145%; Beijing calls move “a joke.”
- US consumer sentiment plunges to 50.8, while short- and long-term inflation expectations surge.
- UK GDP beats forecasts with 0.5% February growth, helping offset global uncertainty and bolster Sterling.
The Pound Sterling extends its gains versus the US Dollar as the US-Sino trade war escalates, with China imposing 125% tariffs on US goods. Trade policies continue to drive price action, with economic data taking a backseat. At the time of writing, the GBP/USD trades at 1.3067, up 0.77%.
GBP/USD jumps 0.77% amid deepening trade war and weak US data; UK growth surprise offers Sterling support
Breaking news revealed that China retaliated against US President Donald Trump's decision to increase duties to 145% on Chinese products. Beijing called the actions a “joke” and said it no longer considers them worth matching.
The economic docket revealed that US Consumer Sentiment deteriorated, according to the University of Michigan. The Index dipped from 57.0 to 50.8 in April. Inflation expectations for one year rose from 5% to 6.7%, and for a five-year period, they increased from 4.1% to 4.4%.
The US Producer Price Index (PPI) fell from 3.2% to 2.7% YoY in March, below estimates of 3.3%. Despite this, Core PPI remained above the 3% threshold at 3.3% YoY, below February’s 3.5%, lower than forecasts of 3.6%.
Meanwhile, Federal Reserve speakers crossed the wires. Minneapolis Neel Kashkari said the CPI report contained good news, though he reaffirmed that inflation remains elevated. Boston Fed Susan Collins said her outlook for the year is higher inflation and slower growth, while St. Louis Fed Alberto Musalem said inflation could climb even as the labor market softens.
Across the pond, the UK’s economy grew above estimates, rising 0.5% in February, beating economists' estimates and providing some relief for Chancellor Rachel Reeves.
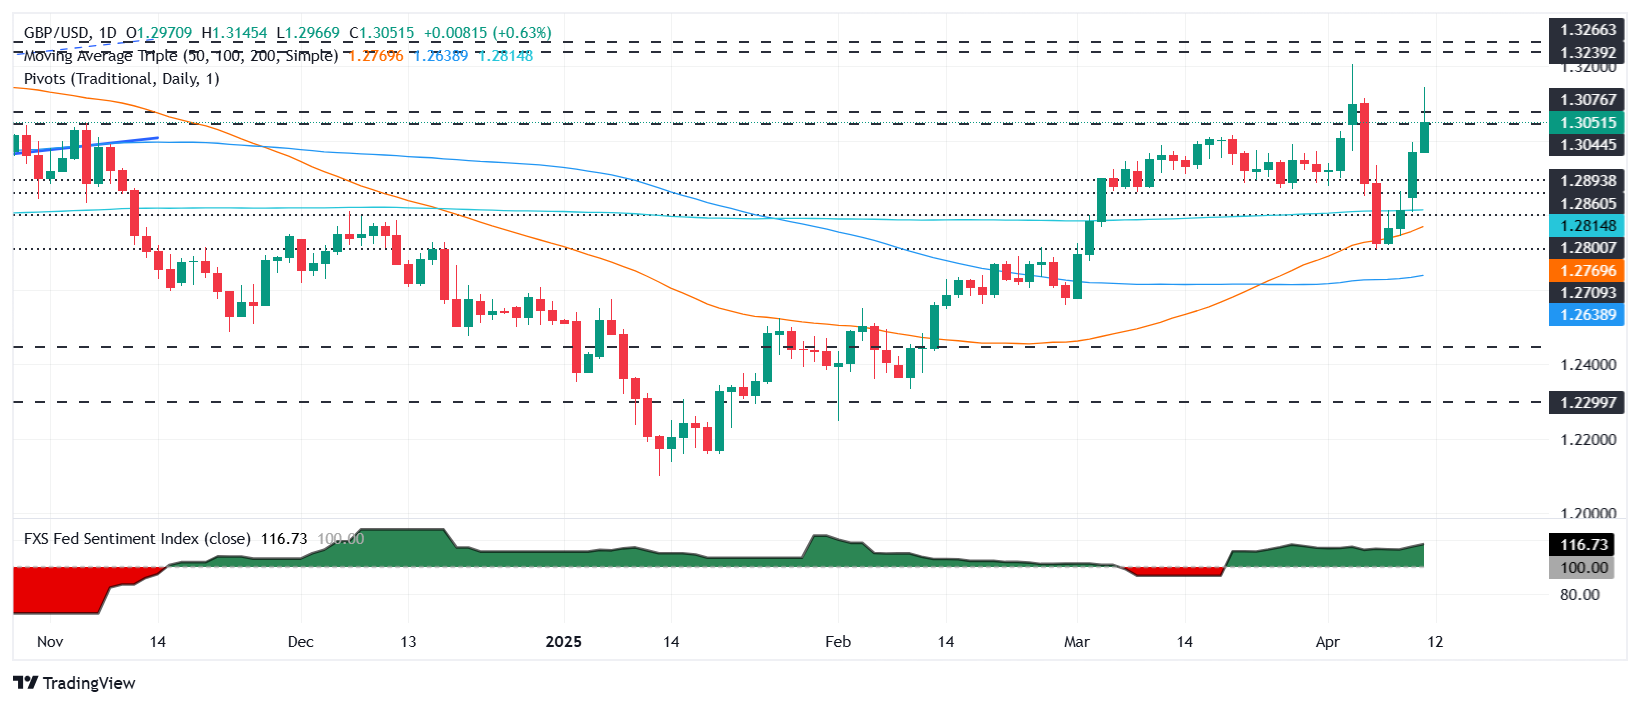
GBP/USD Price Forecast: Technical outlook
Given the backdrop, uncertainty about trade keeps the GBP/USD trading above the 1.30 figure. This opens the door to re-testing six-month peaks reached on April 3 at 1.3207, which, once cleared, puts the 1.3300 figure up for grabs. The Relative Strength Index (RSI) shows that buyers are gathering momentum.
On the other hand, if GBP/USD retreats below 1.30, immediate support emerges at April 11 daily low of 1.2968. A breach of the latter will expose 1.2900 and the 200-day Simple Moving Average (SMA) at 1.2815.
British Pound PRICE This week
The table below shows the percentage change of British Pound (GBP) against listed major currencies this week. British Pound was the strongest against the US Dollar.
| USD | EUR | GBP | JPY | CAD | AUD | NZD | CHF | |
|---|---|---|---|---|---|---|---|---|
| USD | -3.23% | -1.27% | -1.38% | -2.44% | -3.04% | -3.57% | -4.63% | |
| EUR | 3.23% | 2.32% | 2.57% | 1.45% | 0.12% | 0.26% | -0.84% | |
| GBP | 1.27% | -2.32% | -1.05% | -0.85% | -2.12% | -2.01% | -3.09% | |
| JPY | 1.38% | -2.57% | 1.05% | -1.06% | -0.74% | -1.03% | -2.98% | |
| CAD | 2.44% | -1.45% | 0.85% | 1.06% | -0.95% | -1.15% | -2.51% | |
| AUD | 3.04% | -0.12% | 2.12% | 0.74% | 0.95% | 0.12% | -0.98% | |
| NZD | 3.57% | -0.26% | 2.01% | 1.03% | 1.15% | -0.12% | -1.10% | |
| CHF | 4.63% | 0.84% | 3.09% | 2.98% | 2.51% | 0.98% | 1.10% |
The heat map shows percentage changes of major currencies against each other. The base currency is picked from the left column, while the quote currency is picked from the top row. For example, if you pick the British Pound from the left column and move along the horizontal line to the US Dollar, the percentage change displayed in the box will represent GBP (base)/USD (quote).
Related Articles
Amazon Stock Predictions for 2026 to 2030: Will They Exceed Expectations and Achieve Major Long-Term Goals?
TradingKey - As we head into 2026, many investors are questioning where Amazon (AMZN) fits into the technology world.
A Crash After a Surge: Why Silver Lost 40% in a Week?
TradingKey - Spot silver (XAGUSD) prices continue to decline. Silver plunged 20% on Thursday, breaking below $71 per ounce, with the sell-off intensifying on Friday as prices fell further below $64. Compared to the all-time high set on January 29, silver prices have retraced more than 40%, wiping out nearly all gains accumulated over the previous month.
Is Bitcoin’s Four-Year Cycle Dead in 2026?
Is the Bitcoin 4-year cycle dead? After 2025 broke historical records with a red post-halving year, institutional analysts explore if the Bitcoin price has decoupled from the halving countdown. Analyze the impact of spot ETFs, global liquidity, and the roadmap to the 2028 halving in this 2026 market
USD Dollar Trend Forecast: Dollar Index Falls Below 97.0 to 4-Year Low, Will the Dollar Continue To Fall or Bottom Out in 2026?
TradingKey - In January 2026, the US Dollar Index continued its downward trend from 2025, officially breaking below the key 97.0 level and reaching a low of 95.5, marking a nearly four-year low since February 2022.

