Curve DAO and Aethir Price Prediction: CRV and ATH bulls poised for double-digit gains

- Curve DAO and Aethir prices broke above their descending trendline, hinting at an upward trend.
- Momentum indicators of CRV and ATH show a positive outlook, suggesting a rally ahead.
- On-chain data paints a bullish picture as CRV's open interest and ATH's daily active addresses are rising.
Curve DAO (CRV) and Aethir (ATH) prices broke above a descending trendline, hinting at an upward trend. At the time of writing on Friday, CRV rises 5.7% daily and trades at around $0.59, while ATH consolidates recent gains and hovers around $0.031. Momentum indicators of both altcoins show a positive outlook, suggesting a rally ahead. Additionally, on-chain data paints a bullish picture as CRV's open interest and ATH's daily active addresses are rising.
Curve DAO bulls aim for 17% gains
Curve DAO price broke above a descending trendline (drawn by connecting multiple highs since early December) and closed above its 200-day Exponential Moving Average (EMA) at $0.54 on Thursday. At the time of writing on Friday, it gains 5.7% to trade at around $0.59.
If CRV continues its upward trend, it could extend the rally by 17% from its current levels to retest its daily resistance at $0.69. A successful close above that level could extend an additional gain of 20% to retest its January 31 high of $0.83.
The Relative Strength Index (RSI) on the daily chart reads 61, indicating bullish momentum. The Moving Average Convergence Divergence (MACD) indicator also showed a bullish crossover on Thursday, giving a buy signal and suggesting a continuation of the upward trend.
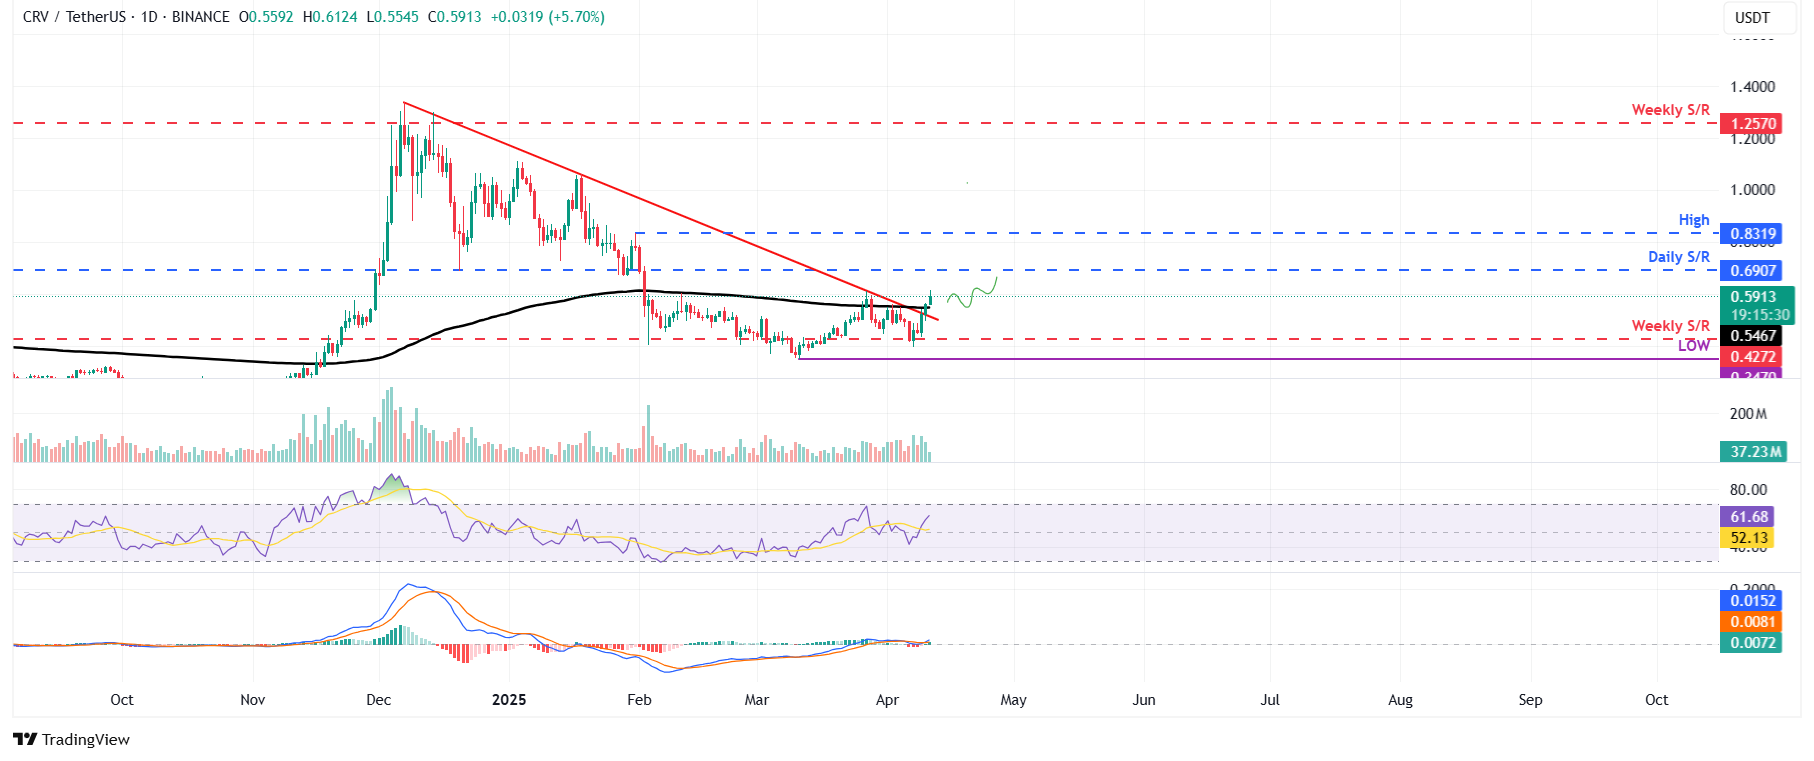
CRV/USDT daily chart
CRV's Open Interest (OI) further supports the bullish outlook. Coinglass’s data shows that the futures’ OI in CRV at exchanges rose to $167.64 million on Friday from $102.04 on Monday, the highest level since February 2. An increasing OI represents new or additional money entering the market and new buying, suggesting a rally ahead in the Curve DAO price.
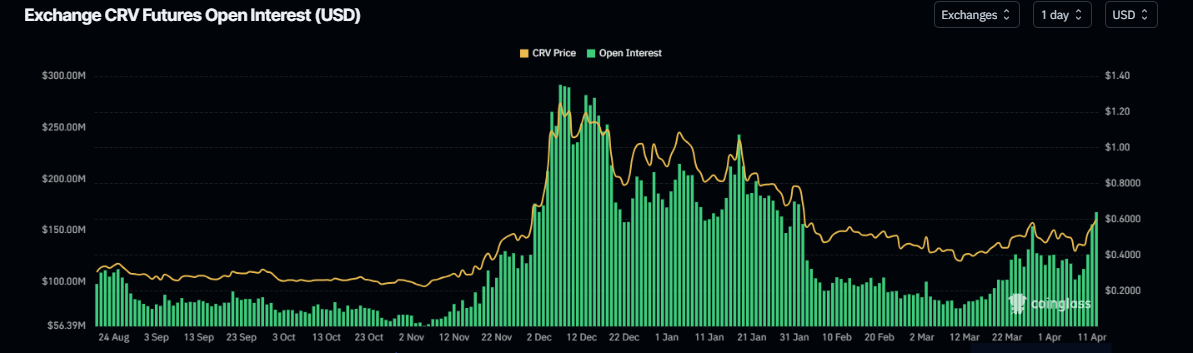
CRV Open Interest chart. Source: Coinglass
Aethir could rally after closing above a descending trendline
Aethir price broke above a descending trendline (drawn by connecting multiple highs since mid-December) and closed above its daily resistance level of $0.030 on Thursday. At the time of writing on Friday, it hovers at around $0.031.
If the daily support at the $0.030 level holds, ATH could extend the rally by 16% from its current level to retest its March 26 high of 0.036. A successful close above that level could extend an additional gain of 11% to retest its next daily resistance at $0.040.
The RSI on the daily chart fattens around its neutral level of 50, indicating indecisiveness among traders. The RSI must move above its neutral level to 50 for the bullish momentum to be sustained.
On Thursday, the MACD indicator showed a bullish crossover, giving a buy signal and suggesting a continuation of the upward trend.
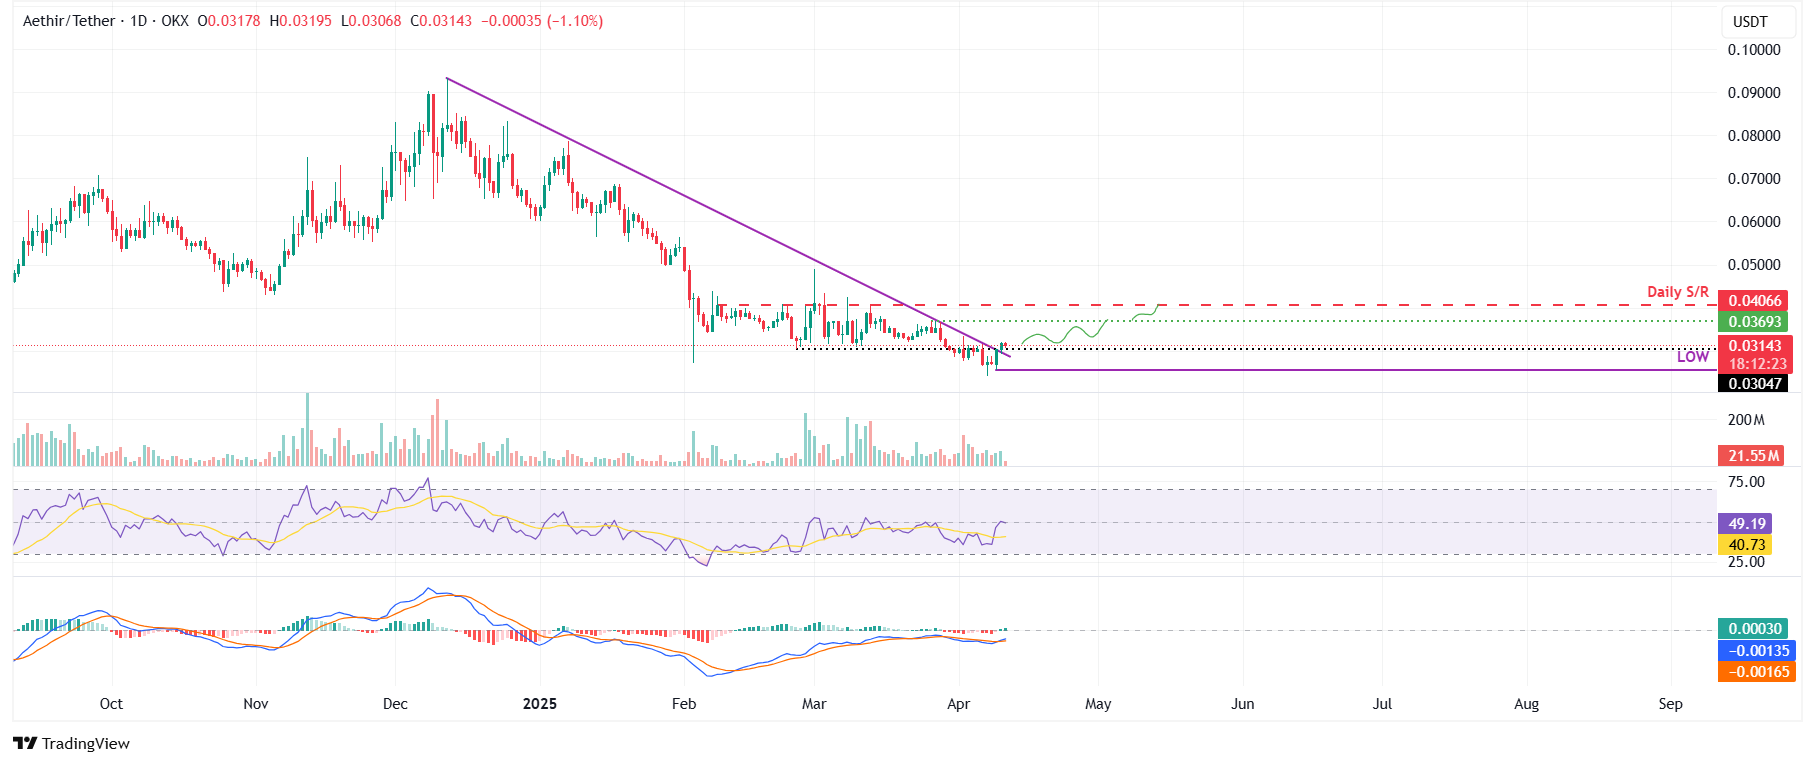
ATH/USDT daily chart
Santiment's Daily Active Addresses index, which helps track network activity over time, aligns with the bullish outlook noted from the technical perspective. A rise in the metric signals greater blockchain usage, while declining addresses point to lower demand for the network.
In ATH's case, Daily Active Addresses have risen by 39% in the last 4 days. This rise is the highest since the end of March and indicates that demand for ATH's blockchain usage is increasing, which could propel a rally in Aethir's price.
 [11-1744355317347.25.15, 11 Apr, 2025].png)
ATH’s active addresses chart. Source: Santiment
Related Articles
Amazon Stock Predictions for 2026 to 2030: Will They Exceed Expectations and Achieve Major Long-Term Goals?
TradingKey - As we head into 2026, many investors are questioning where Amazon (AMZN) fits into the technology world.
A Crash After a Surge: Why Silver Lost 40% in a Week?
TradingKey - Spot silver (XAGUSD) prices continue to decline. Silver plunged 20% on Thursday, breaking below $71 per ounce, with the sell-off intensifying on Friday as prices fell further below $64. Compared to the all-time high set on January 29, silver prices have retraced more than 40%, wiping out nearly all gains accumulated over the previous month.
Is Bitcoin’s Four-Year Cycle Dead in 2026?
Is the Bitcoin 4-year cycle dead? After 2025 broke historical records with a red post-halving year, institutional analysts explore if the Bitcoin price has decoupled from the halving countdown. Analyze the impact of spot ETFs, global liquidity, and the roadmap to the 2028 halving in this 2026 market
Disney Trend Forecast: Disney FY26 First Quarter Net Profit Falls 6% Stock Price Slumps 7.4% Can Stock Price Continue to Rise in 2026?
TradingKey - At the start of 2026, global entertainment giant Disney (DIS) faced a disappointing start to the year. Its Q1 FY2026 earnings report showed that revenue grew 5% year-on-year to $25.98 billion, seemingly achieving steady growth; however, net profit fell 6% year-on-year to $2.4 billion. N