

Dow Jones Industrial Average flip-flops as equities struggle to find footing

- The Dow Jones tested higher on Thursday, but remains hobbled by 42,000.
- Equity markets lurched higher after better-than-expected housing figures before settling again.
- US Intitial Jobless Claims came in under their four-week average, and manufacturing sentiment fell less than expected.
The Dow Jones Industrial Average (DJIA) continued to challenge the 42,000 key handle on Thursday, catching an early rise after US economic figures broadly beat forecasts. However, investor sentiment remains tepid overall as ongoing trade war fears continue to simmer on the back burner.
The Dow Jones is trading within one-fifth of one percent of Thursday’s opening bids near 41,950, and the Standard & Poor’s 500 (S&P 500) shed around one-quarter of one percent, falling to 5,660. The NASDAQ tech index backslid 60 points to test below 17,700.
The Philadelphia Federal Reserve (Fed) Bank’s Manufacturing Survey for March eased to 12.5 MoM, falling from the previous month’s 18.1 and declining for the second month in a row, but pulling the brakes and falling less than the median market forecast of 8.5. US weekly Initial Jobless Claims also rose slightly less than expected, clocking in at 223K net new jobless benefits seekers compared to the previous week’s 220K. Investors had expected a print of 224K. US Existing Home Sales also rose nearly a third of a million more transactions than expected, rising to 4.26 million units moved in February compared to January’s revised 4.09 million. Market watchers had expected a slight slowing to 3.95 million.
Stocks news
The majority of equity sectors are testing the low side on Thursday, with losses being led by the technology sector as the AI-fueled tech rally continues to sputter out. Energy and financial stocks rose moderately as economic data leaks back to the front of the pack over geopolitical headlines.
Darden Restaurants (DRI) bounced over 5% to around $200 per share after posting better-than-expected earnings figures ahead of Thursday’s market open. Accenture PLC (ACN) plunged nearly 8% on the day, falling below $300 per share despite beatings earnings forecasts as investors grow uneasy about flat bookings growth and a general decrease in operating margins.
Dow Jones price forecast
The Dow Jones continues to churn just south of key price levels, marking in several failed attempts to crack back through the 200-day Exponential Moving Average (EMA) near the 42,000 major price handle. Price action is still tilted in favor of buyers, but a lack of topside momentum is keeping bids hobbled by a new technical ceiling.
Dow Jones daily chart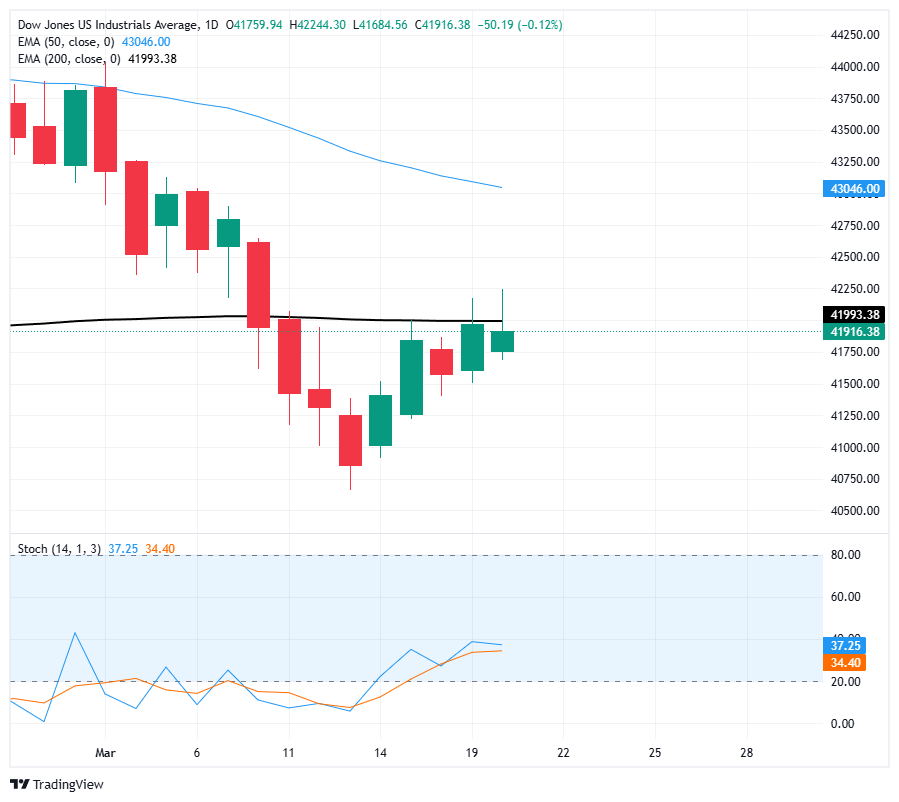
Dow Jones FAQs
The Dow Jones Industrial Average, one of the oldest stock market indices in the world, is compiled of the 30 most traded stocks in the US. The index is price-weighted rather than weighted by capitalization. It is calculated by summing the prices of the constituent stocks and dividing them by a factor, currently 0.152. The index was founded by Charles Dow, who also founded the Wall Street Journal. In later years it has been criticized for not being broadly representative enough because it only tracks 30 conglomerates, unlike broader indices such as the S&P 500.
Many different factors drive the Dow Jones Industrial Average (DJIA). The aggregate performance of the component companies revealed in quarterly company earnings reports is the main one. US and global macroeconomic data also contributes as it impacts on investor sentiment. The level of interest rates, set by the Federal Reserve (Fed), also influences the DJIA as it affects the cost of credit, on which many corporations are heavily reliant. Therefore, inflation can be a major driver as well as other metrics which impact the Fed decisions.
Dow Theory is a method for identifying the primary trend of the stock market developed by Charles Dow. A key step is to compare the direction of the Dow Jones Industrial Average (DJIA) and the Dow Jones Transportation Average (DJTA) and only follow trends where both are moving in the same direction. Volume is a confirmatory criteria. The theory uses elements of peak and trough analysis. Dow’s theory posits three trend phases: accumulation, when smart money starts buying or selling; public participation, when the wider public joins in; and distribution, when the smart money exits.
There are a number of ways to trade the DJIA. One is to use ETFs which allow investors to trade the DJIA as a single security, rather than having to buy shares in all 30 constituent companies. A leading example is the SPDR Dow Jones Industrial Average ETF (DIA). DJIA futures contracts enable traders to speculate on the future value of the index and Options provide the right, but not the obligation, to buy or sell the index at a predetermined price in the future. Mutual funds enable investors to buy a share of a diversified portfolio of DJIA stocks thus providing exposure to the overall index.
Related Articles
Amazon Stock Predictions for 2026 to 2030: Will They Exceed Expectations and Achieve Major Long-Term Goals?
TradingKey - As we head into 2026, many investors are questioning where Amazon (AMZN) fits into the technology world.
A Crash After a Surge: Why Silver Lost 40% in a Week?
TradingKey - Spot silver (XAGUSD) prices continue to decline. Silver plunged 20% on Thursday, breaking below $71 per ounce, with the sell-off intensifying on Friday as prices fell further below $64. Compared to the all-time high set on January 29, silver prices have retraced more than 40%, wiping out nearly all gains accumulated over the previous month.
Google Cloud Revenue Surges 48% in Q4 as CapEx Guidance Nearly Doubles: Why the 7.5% After-Hours Dip?
TradingKey - After the close on February 4 (ET), Google (GOOG, GOOGL) released stellar Q4 results: total revenue grew 18% year-over-year, hitting a new quarterly record after revenue first surpassed $100 billion in Q3. The primary highlight was Google Cloud, where Q4 revenue surged 48% year-over-yea
Is Bitcoin’s Four-Year Cycle Dead in 2026?
Is the Bitcoin 4-year cycle dead? After 2025 broke historical records with a red post-halving year, institutional analysts explore if the Bitcoin price has decoupled from the halving countdown. Analyze the impact of spot ETFs, global liquidity, and the roadmap to the 2028 halving in this 2026 market

