

US Dollar Price Forecast: Bearish outlook remains in play near 106.50

- The US Dollar Index strengthens to near 106.65 in Thursday’s early European session.
- The negative outlook of the DXY remains intact below the 100-day EMA, but further consolidation cannot be ruled out.
- The first support level is seen at 106.20; the immediate resistance level emerges at 106.80.
The US Dollar Index (DXY) gains traction to near 106.65 during the early European session on Thursday. The cautious mood amid the tariff uncertainty from US President Donald Trump could lift the Greenback.
However, the weaker US economic data have prompted traders to raise bets for interest rate cuts, now seeing two quarter-point reductions this year, with the first likely in July and the next as early as October. This, in turn, might cap the upside for the DXY.
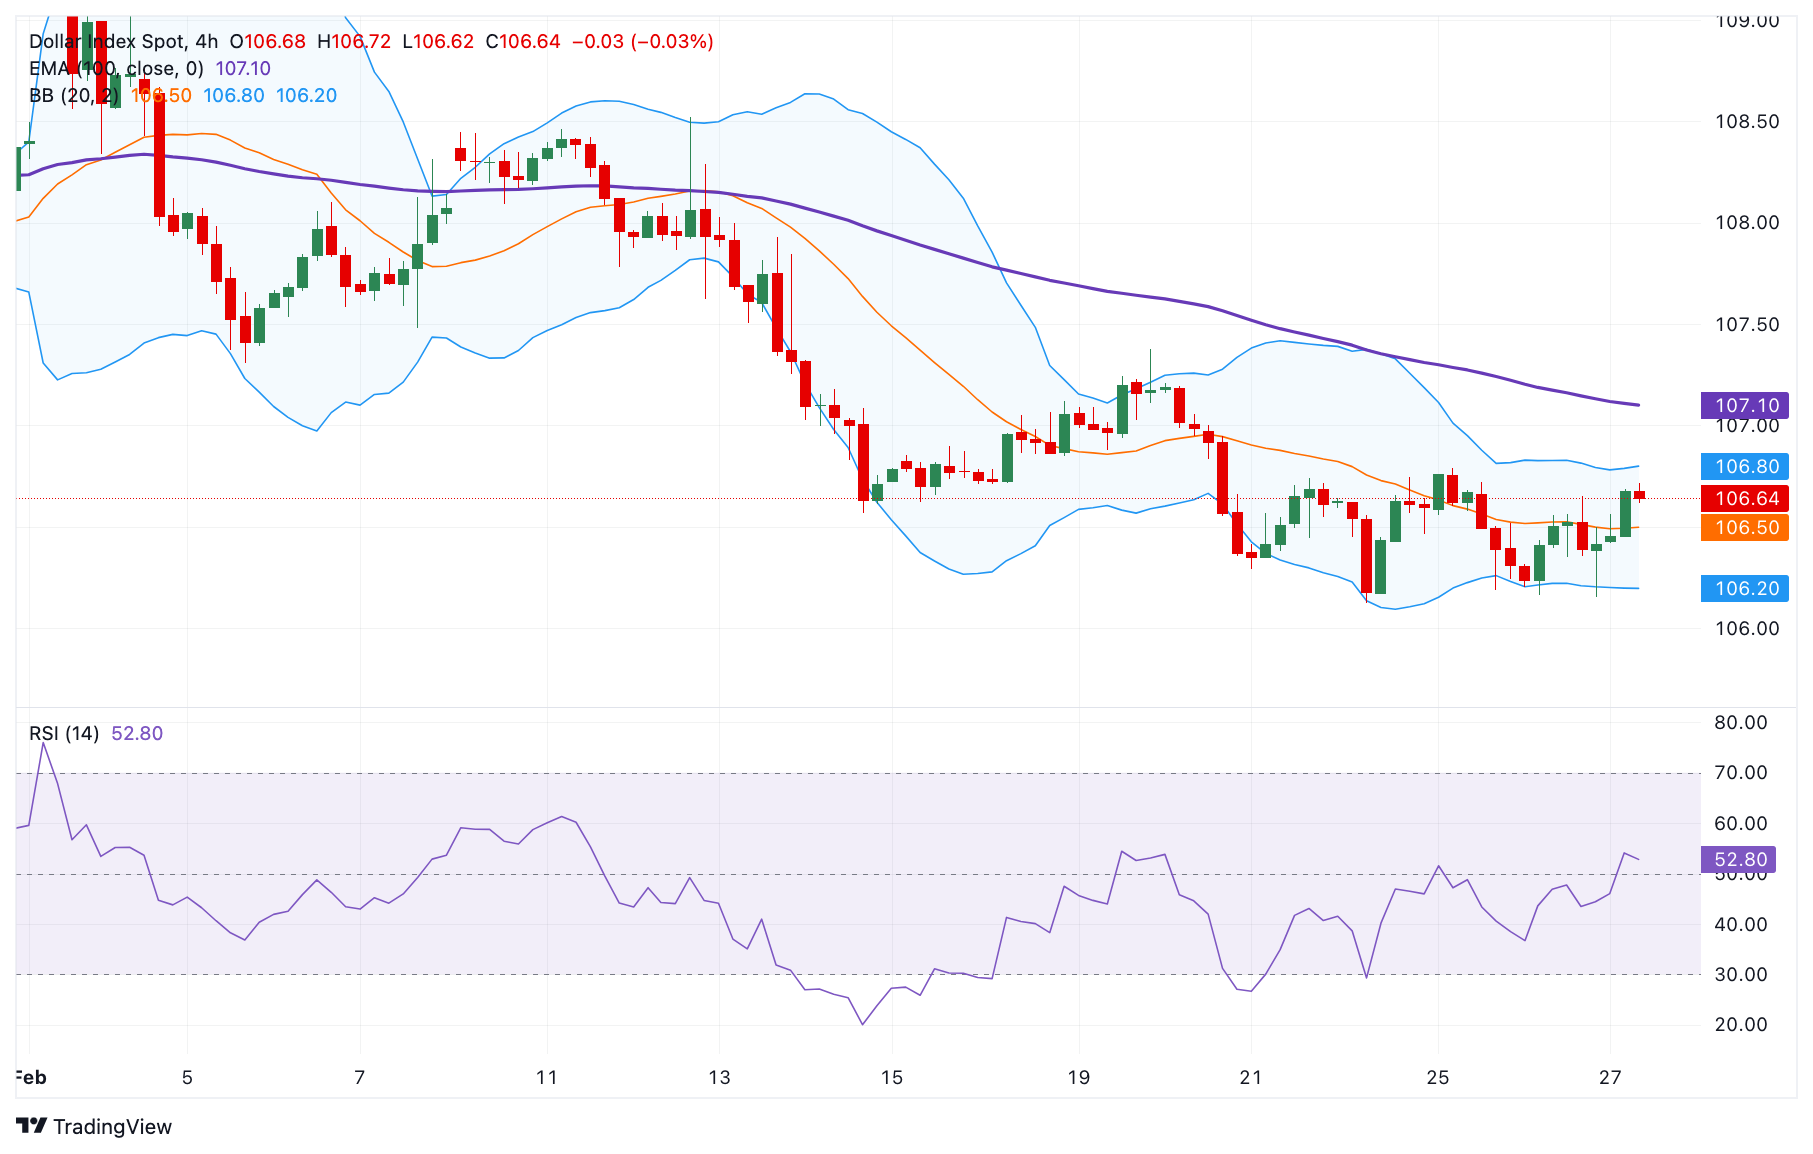
According to the 4-hour chart, the DXY keeps the bearish vibe as the price remains capped below the key 100-period EMA Exponential Moving Average (EMA). Nonetheless, further consolidation cannot be ruled out as the 14-day Relative Strength Index (RSI) crosses above the midline near 53.35.
The lower limit of the Bollinger Band at 106.20 acts as an initial support level for the index. A decisive break below the mentioned level could expose 105.80, the low of December 9. Extended losses could see a drop to 105.41, the low of December 6.
On the upside, the first upside barrier for the DXY emerges at 106.80, the upper boundary of the Bollinger Band. Sustained bullish momentum above this level could pave the way to the 107.00-107.10 region, the psychological level and the 100-EMA EMA. The next hurdle to watch is 107.38, the high of February 19.
US Dollar Index (DXY) 4-hour chart
US Dollar FAQs
The US Dollar (USD) is the official currency of the United States of America, and the ‘de facto’ currency of a significant number of other countries where it is found in circulation alongside local notes. It is the most heavily traded currency in the world, accounting for over 88% of all global foreign exchange turnover, or an average of $6.6 trillion in transactions per day, according to data from 2022. Following the second world war, the USD took over from the British Pound as the world’s reserve currency. For most of its history, the US Dollar was backed by Gold, until the Bretton Woods Agreement in 1971 when the Gold Standard went away.
The most important single factor impacting on the value of the US Dollar is monetary policy, which is shaped by the Federal Reserve (Fed). The Fed has two mandates: to achieve price stability (control inflation) and foster full employment. Its primary tool to achieve these two goals is by adjusting interest rates. When prices are rising too quickly and inflation is above the Fed’s 2% target, the Fed will raise rates, which helps the USD value. When inflation falls below 2% or the Unemployment Rate is too high, the Fed may lower interest rates, which weighs on the Greenback.
In extreme situations, the Federal Reserve can also print more Dollars and enact quantitative easing (QE). QE is the process by which the Fed substantially increases the flow of credit in a stuck financial system. It is a non-standard policy measure used when credit has dried up because banks will not lend to each other (out of the fear of counterparty default). It is a last resort when simply lowering interest rates is unlikely to achieve the necessary result. It was the Fed’s weapon of choice to combat the credit crunch that occurred during the Great Financial Crisis in 2008. It involves the Fed printing more Dollars and using them to buy US government bonds predominantly from financial institutions. QE usually leads to a weaker US Dollar.
Quantitative tightening (QT) is the reverse process whereby the Federal Reserve stops buying bonds from financial institutions and does not reinvest the principal from the bonds it holds maturing in new purchases. It is usually positive for the US Dollar.
Related Articles
Amazon Stock Predictions for 2026 to 2030: Will They Exceed Expectations and Achieve Major Long-Term Goals?
TradingKey - As we head into 2026, many investors are questioning where Amazon (AMZN) fits into the technology world.
A Crash After a Surge: Why Silver Lost 40% in a Week?
TradingKey - Spot silver (XAGUSD) prices continue to decline. Silver plunged 20% on Thursday, breaking below $71 per ounce, with the sell-off intensifying on Friday as prices fell further below $64. Compared to the all-time high set on January 29, silver prices have retraced more than 40%, wiping out nearly all gains accumulated over the previous month.
Google Cloud Revenue Surges 48% in Q4 as CapEx Guidance Nearly Doubles: Why the 7.5% After-Hours Dip?
TradingKey - After the close on February 4 (ET), Google (GOOG, GOOGL) released stellar Q4 results: total revenue grew 18% year-over-year, hitting a new quarterly record after revenue first surpassed $100 billion in Q3. The primary highlight was Google Cloud, where Q4 revenue surged 48% year-over-yea
Is Bitcoin’s Four-Year Cycle Dead in 2026?
Is the Bitcoin 4-year cycle dead? After 2025 broke historical records with a red post-halving year, institutional analysts explore if the Bitcoin price has decoupled from the halving countdown. Analyze the impact of spot ETFs, global liquidity, and the roadmap to the 2028 halving in this 2026 market

