

US Dollar Index Price Forecast: Tests 106.50 near descending channel's lower boundary

- The US Dollar Index may find immediate support at the descending channel’s lower boundary at 106.10.
- The 14-day RSI remains below 50, reinforcing bearish bias.
- The primary resistance appears at the nine-day EMA at 107.00.
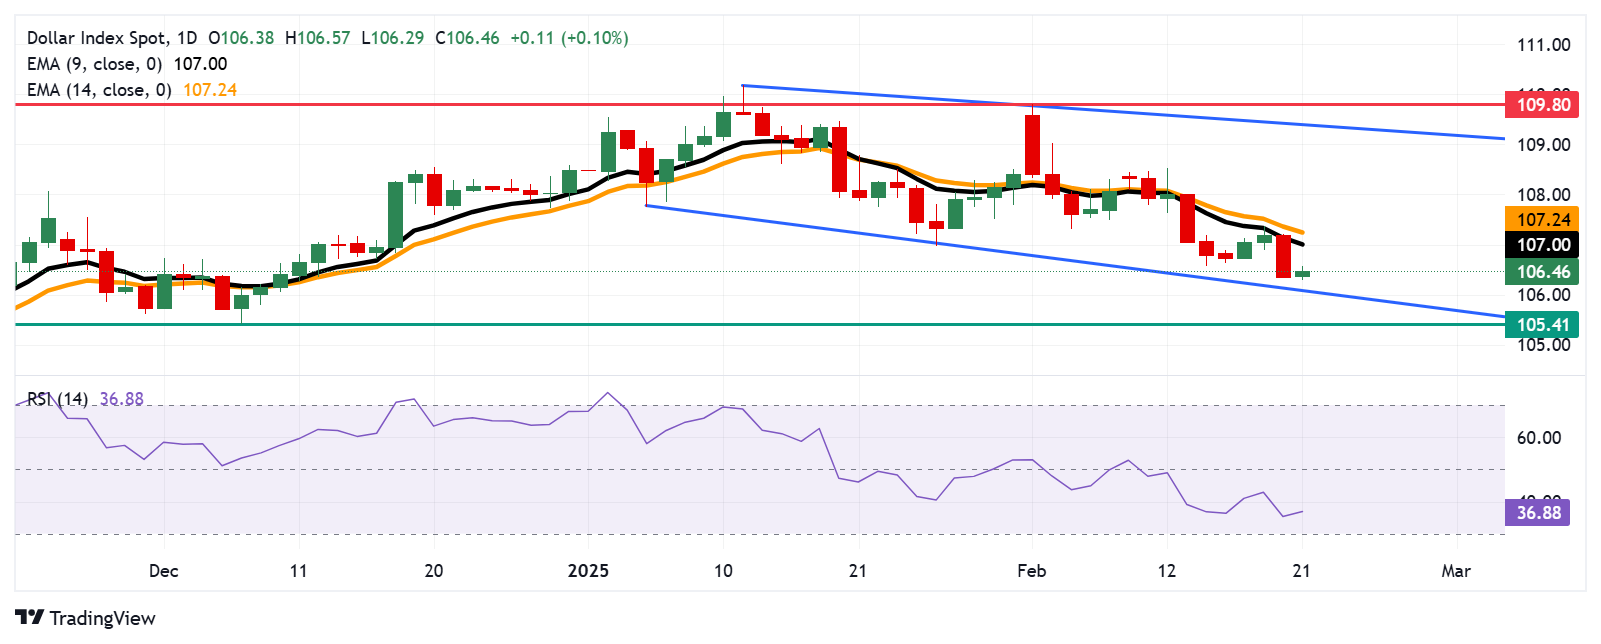
The US Dollar Index (DXY), which measures the value of the US Dollar (USD) against its six major peers, maintains its ground around 106.50 during the early European hours on Friday. However, the analysis of the daily chart indicates a bearish bias, with the index consolidating within a descending channel pattern.
The 14-day Relative Strength Index (RSI) remains below the 50 level, signaling a strengthening bearish momentum. Additionally, the US Dollar Index is trading below the nine- and 14-day Exponential Moving Averages (EMAs), reinforcing a weakening short-term price trend.
On the downside, the US Dollar Index may test the lower boundary of the descending channel at 106.10, followed by the key psychological level of 106.00. A break below this critical support zone could strengthen the bearish bias, potentially driving the index toward the three-month low of 105.41, last seen on December 6.
The DXY's primary resistance stands at the nine-day EMA at 107.00, followed by the 14-day EMA at 107.24. A decisive break above these levels could strengthen short-term price momentum, potentially pushing the index toward the descending channel’s upper boundary at 109.40, with the next key resistance at the five-week high of 109.80, last tested on February 3.
US Dollar Index: Daily Chart
US Dollar PRICE Today
The table below shows the percentage change of US Dollar (USD) against listed major currencies today. US Dollar was the strongest against the Japanese Yen.
| USD | EUR | GBP | JPY | CAD | AUD | NZD | CHF |
|---|---|---|---|---|---|---|---|---|
USD |
| 0.05% | -0.03% | 0.50% | 0.08% | 0.18% | 0.06% | 0.12% |
EUR | -0.05% |
| -0.08% | 0.47% | 0.03% | 0.14% | 0.01% | 0.07% |
GBP | 0.03% | 0.08% |
| 0.55% | 0.11% | 0.21% | 0.08% | 0.12% |
JPY | -0.50% | -0.47% | -0.55% |
| -0.40% | -0.30% | -0.44% | -0.40% |
CAD | -0.08% | -0.03% | -0.11% | 0.40% |
| 0.10% | -0.02% | 0.01% |
AUD | -0.18% | -0.14% | -0.21% | 0.30% | -0.10% |
| -0.13% | -0.08% |
NZD | -0.06% | -0.01% | -0.08% | 0.44% | 0.02% | 0.13% |
| 0.03% |
CHF | -0.12% | -0.07% | -0.12% | 0.40% | -0.01% | 0.08% | -0.03% |
|
The heat map shows percentage changes of major currencies against each other. The base currency is picked from the left column, while the quote currency is picked from the top row. For example, if you pick the US Dollar from the left column and move along the horizontal line to the Japanese Yen, the percentage change displayed in the box will represent USD (base)/JPY (quote).
Related Articles
$660B Capex Bill Triggers $900B Wipeout: Why Apple Shares Outperform Amazon and Google Despite AI Lag
Based on financial disclosures, the combined 2026 capital expenditure forecasts for Meta, Amazon, Google, and Microsoft are projected to reach $660 billion. This figure is not only significantly higher than the $410 billion forecast for 2025 and $245 billion for 2024, but even surpasses the GDP of I
Amazon Stock Predictions for 2026 to 2030: Will They Exceed Expectations and Achieve Major Long-Term Goals?
TradingKey - As we head into 2026, many investors are questioning where Amazon (AMZN) fits into the technology world.
A Crash After a Surge: Why Silver Lost 40% in a Week?
TradingKey - Spot silver (XAGUSD) prices continue to decline. Silver plunged 20% on Thursday, breaking below $71 per ounce, with the sell-off intensifying on Friday as prices fell further below $64. Compared to the all-time high set on January 29, silver prices have retraced more than 40%, wiping out nearly all gains accumulated over the previous month.
Is Bitcoin’s Four-Year Cycle Dead in 2026?
Is the Bitcoin 4-year cycle dead? After 2025 broke historical records with a red post-halving year, institutional analysts explore if the Bitcoin price has decoupled from the halving countdown. Analyze the impact of spot ETFs, global liquidity, and the roadmap to the 2028 halving in this 2026 market

