US Dollar snaps under pressure and dives lower ahead of US Retail Sales

- The US Dollar takes a beating and loses traction against nearly all major peers on Friday.
- Traders brace for the US Retail Sales, although tariffs and geopolitics are making the scene.
- The US Dollar Index (DXY) drops substantially below 108.00 and is on its way to the lower 106-region.
The US Dollar Index (DXY), which tracks the performance of the US Dollar (USD) against six major currencies, sinks lower, trading around 106.80 at the time of writing on Friday. The Greenback came under pressure again after US President Donald Trump signed a memo on Thursday that instructed staff to work on reciprocal tariffs. These tariffs will take weeks or even months before being implemented, which gives time to US trading partners to negotiate and find solutions.
The economic calendar is focusing on US Retail Sales this Friday. Although US data tends to be market-moving, it seems markets are rather ignoring this week’s figures. Next week, investors will focus on the S&P Global Purchase Managers Index (PMI) preliminary data for February due on Friday 21.
Daily digest market movers: Signed but not there yet
- At 13:30, nearly all important data for this Friday will be released:
- January Import/Export prices are due, with the monthly Export Price Index expected to rise steadily by 0.3% and the Import Price Index to jump 0.4% compared to 0.1% in December.
- January Retail Sales will be published, with the headline figure expected to shrink by 0.1% compared to 0.4% growth in December. Retail Sales without Cars and Transportation should fall to 0.3% from 0.4% in the previous month.
- Equities are mixed due to all the geopolitical elements moving around. On average, most indices are down or up by less than 0.5%.
- The CME FedWatch tool shows a 57.4% chance that interest rates will remain unchanged at current levels in June. This suggests that the Fed would keep rates unchanged for longer to fight against persistent inflation.
- The US 10-year yield is trading around 4.54%, a deep dive from this week’s high of 4.657%.
US Dollar Index Technical Analysis: There it goes
The US Dollar Index (DXY) is done for this week. A clear weekly loss is unavoidable, and the strong resistance at 107.35 is far away. From here, the DXY is technically handed over to the mercy of the moving averages and the Relative Strength Index (RSI), which is still bearing plenty of room for more downturn. The 200-day Simple Moving Average (SMA), trading around 104.93, might be the one to look out for.
On the upside, that previous support at 107.35 has now turned into a firm resistance. Further up, the 55-day SMA at 107.90 must be regained before reclaiming 108.00.
On the downside, look for 106.52 (April 16, 2024, high), 106.34 (100-day SMA), or even 105.89 (resistance in June 2024) as better support levels. Even though the RSI shows room for more downside, the 200-day SMA at 104.93 could be a possible outcome.
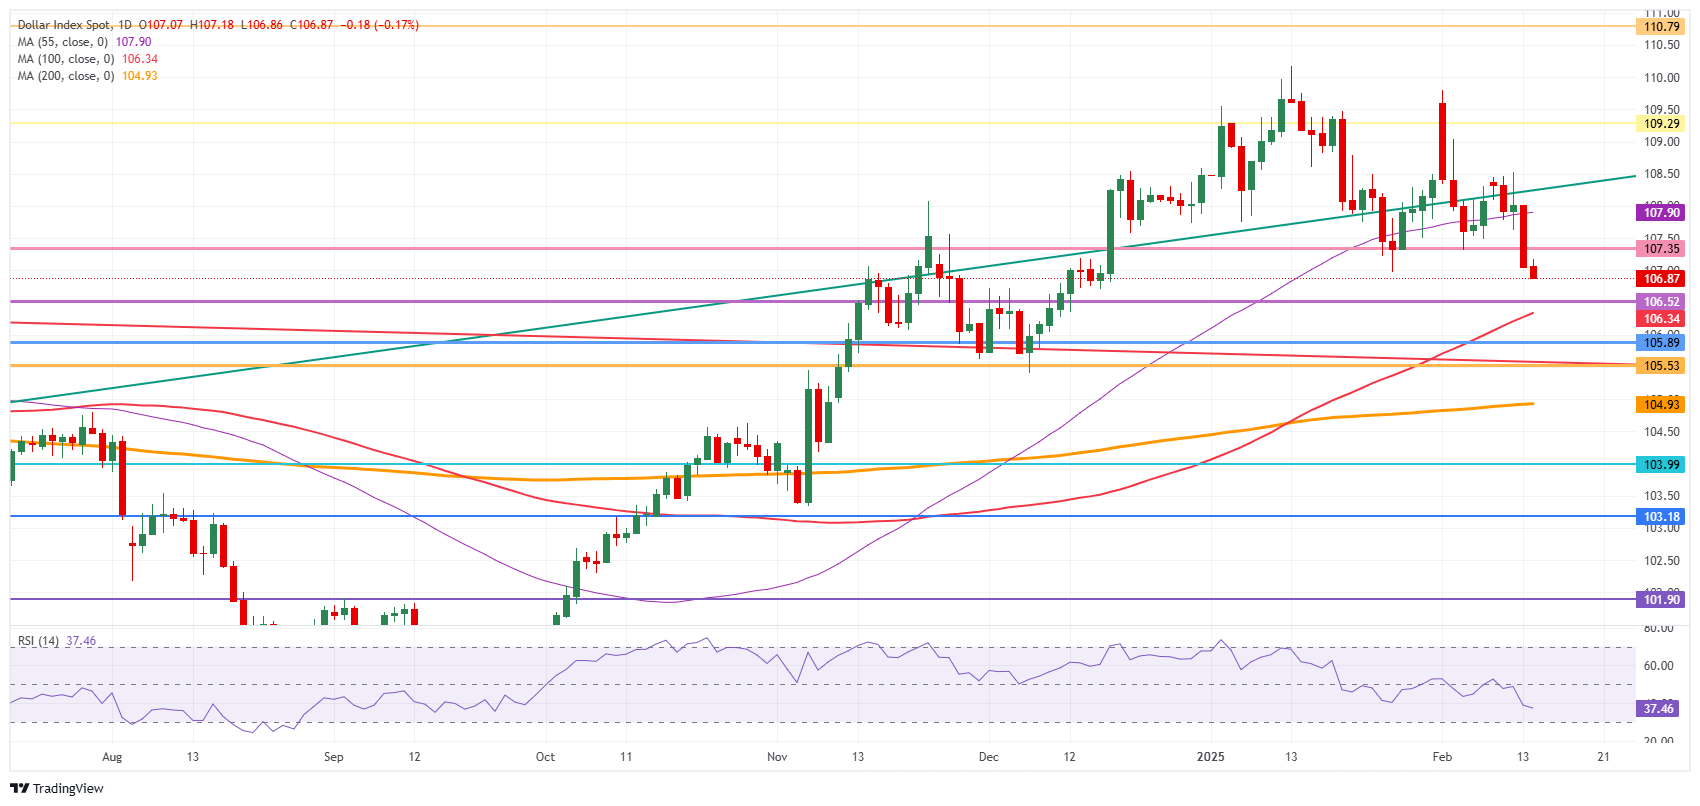
US Dollar Index: Daily Chart
US Dollar FAQs
The US Dollar (USD) is the official currency of the United States of America, and the ‘de facto’ currency of a significant number of other countries where it is found in circulation alongside local notes. It is the most heavily traded currency in the world, accounting for over 88% of all global foreign exchange turnover, or an average of $6.6 trillion in transactions per day, according to data from 2022. Following the second world war, the USD took over from the British Pound as the world’s reserve currency. For most of its history, the US Dollar was backed by Gold, until the Bretton Woods Agreement in 1971 when the Gold Standard went away.
The most important single factor impacting on the value of the US Dollar is monetary policy, which is shaped by the Federal Reserve (Fed). The Fed has two mandates: to achieve price stability (control inflation) and foster full employment. Its primary tool to achieve these two goals is by adjusting interest rates. When prices are rising too quickly and inflation is above the Fed’s 2% target, the Fed will raise rates, which helps the USD value. When inflation falls below 2% or the Unemployment Rate is too high, the Fed may lower interest rates, which weighs on the Greenback.
In extreme situations, the Federal Reserve can also print more Dollars and enact quantitative easing (QE). QE is the process by which the Fed substantially increases the flow of credit in a stuck financial system. It is a non-standard policy measure used when credit has dried up because banks will not lend to each other (out of the fear of counterparty default). It is a last resort when simply lowering interest rates is unlikely to achieve the necessary result. It was the Fed’s weapon of choice to combat the credit crunch that occurred during the Great Financial Crisis in 2008. It involves the Fed printing more Dollars and using them to buy US government bonds predominantly from financial institutions. QE usually leads to a weaker US Dollar.
Quantitative tightening (QT) is the reverse process whereby the Federal Reserve stops buying bonds from financial institutions and does not reinvest the principal from the bonds it holds maturing in new purchases. It is usually positive for the US Dollar.
Related Articles
Amazon Stock Predictions for 2026 to 2030: Will They Exceed Expectations and Achieve Major Long-Term Goals?
TradingKey - As we head into 2026, many investors are questioning where Amazon (AMZN) fits into the technology world.
A Crash After a Surge: Why Silver Lost 40% in a Week?
TradingKey - Spot silver (XAGUSD) prices continue to decline. Silver plunged 20% on Thursday, breaking below $71 per ounce, with the sell-off intensifying on Friday as prices fell further below $64. Compared to the all-time high set on January 29, silver prices have retraced more than 40%, wiping out nearly all gains accumulated over the previous month.
Is Bitcoin’s Four-Year Cycle Dead in 2026?
Is the Bitcoin 4-year cycle dead? After 2025 broke historical records with a red post-halving year, institutional analysts explore if the Bitcoin price has decoupled from the halving countdown. Analyze the impact of spot ETFs, global liquidity, and the roadmap to the 2028 halving in this 2026 market
Disney Trend Forecast: Disney FY26 First Quarter Net Profit Falls 6% Stock Price Slumps 7.4% Can Stock Price Continue to Rise in 2026?
TradingKey - At the start of 2026, global entertainment giant Disney (DIS) faced a disappointing start to the year. Its Q1 FY2026 earnings report showed that revenue grew 5% year-on-year to $25.98 billion, seemingly achieving steady growth; however, net profit fell 6% year-on-year to $2.4 billion. N