

US Dollar Price Forecast: Could test nine-day EMA barrier near 108.00

- The US Dollar Index may find its initial resistance at the nine-day EMA at 107.94.
- A successful break above the 50 mark would confirm the emergence of a bullish bias.
- The immediate support appears around the descending channel’s upper boundary at 107.30 level.
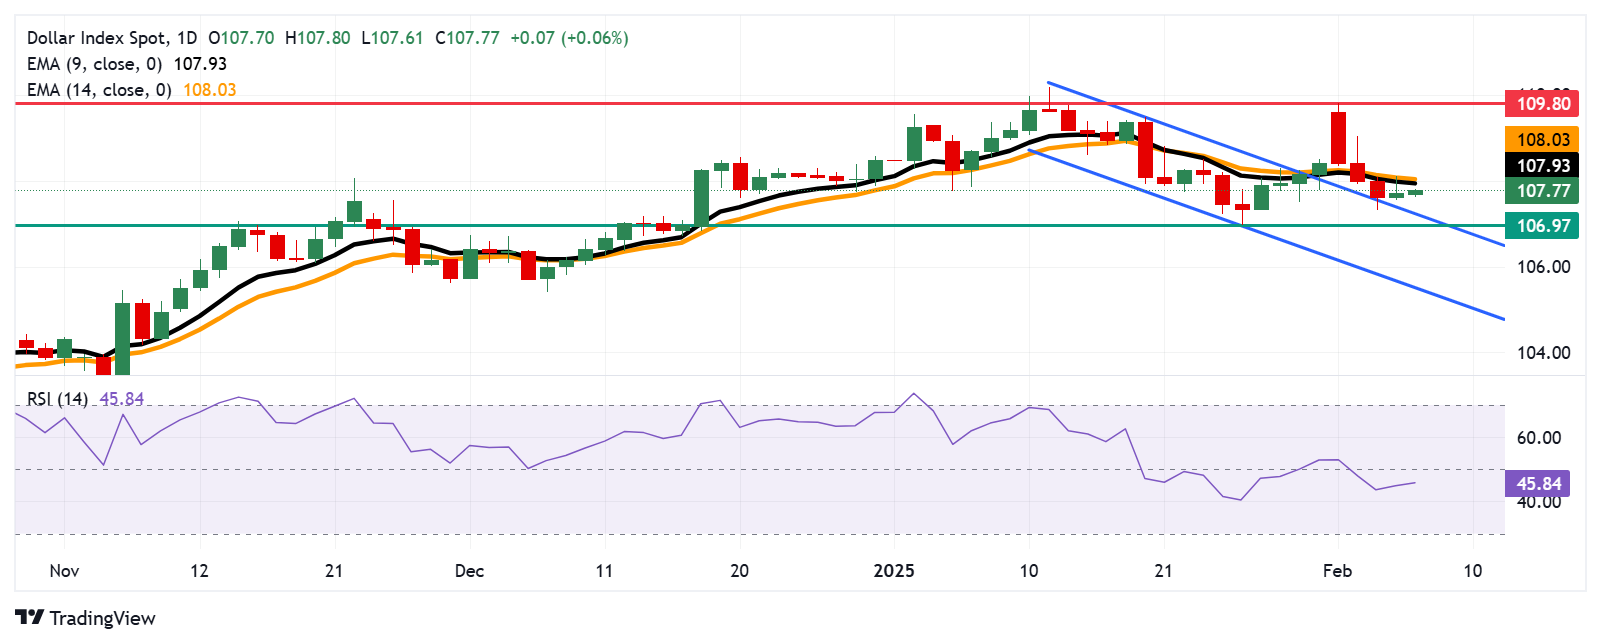
The US Dollar Index (DXY) continues its upward momentum for the second consecutive day, trading around 107.80 during Asian hours on Friday. A review of the daily chart suggests a weakening bearish bias as the index consolidates above the descending channel pattern.
The 14-day Relative Strength Index (RSI) remains just below the 50 level, indicating that bearish sentiment is still present. A decisive move above the 50 mark would confirm a shift from a bearish to a bullish bias. Furthermore, the US Dollar Index remains below its nine- and 14-day Exponential Moving Averages (EMAs), signaling weaker short-term price momentum.
On the downside, the upper boundary of the descending channel serves as the key support near 107.30, followed by the two-month low of 106.97, which was recorded on January 27. A drop below the latter could strengthen the bearish bias, pushing the index toward the lower boundary of the descending channel at 105.60.
Regarding resistance, the DXY may first challenge the nine-day EMA at 107.94, followed by the 14-day EMA at 108.03. A breakout above these levels could enhance short-term price momentum, potentially driving the index toward its three-week high of 109.80, last tested on February 3.
US Dollar Index: Daily Chart
US Dollar PRICE Today
The table below shows the percentage change of US Dollar (USD) against listed major currencies today. US Dollar was the strongest against the Swiss Franc.
| USD | EUR | GBP | JPY | CAD | AUD | NZD | CHF |
|---|---|---|---|---|---|---|---|---|
USD |
| 0.08% | 0.12% | 0.12% | 0.11% | 0.02% | -0.02% | 0.16% |
EUR | -0.08% |
| 0.04% | 0.02% | 0.04% | -0.05% | -0.10% | 0.08% |
GBP | -0.12% | -0.04% |
| -0.02% | -0.01% | -0.10% | -0.13% | 0.04% |
JPY | -0.12% | -0.02% | 0.02% |
| -0.01% | -0.10% | -0.16% | 0.03% |
CAD | -0.11% | -0.04% | 0.01% | 0.01% |
| -0.10% | -0.13% | 0.05% |
AUD | -0.02% | 0.05% | 0.10% | 0.10% | 0.10% |
| -0.04% | 0.14% |
NZD | 0.02% | 0.10% | 0.13% | 0.16% | 0.13% | 0.04% |
| 0.18% |
CHF | -0.16% | -0.08% | -0.04% | -0.03% | -0.05% | -0.14% | -0.18% |
|
The heat map shows percentage changes of major currencies against each other. The base currency is picked from the left column, while the quote currency is picked from the top row. For example, if you pick the US Dollar from the left column and move along the horizontal line to the Japanese Yen, the percentage change displayed in the box will represent USD (base)/JPY (quote).
Related Articles
Amazon Stock Predictions for 2026 to 2030: Will They Exceed Expectations and Achieve Major Long-Term Goals?
TradingKey - As we head into 2026, many investors are questioning where Amazon (AMZN) fits into the technology world.
A Crash After a Surge: Why Silver Lost 40% in a Week?
TradingKey - Spot silver (XAGUSD) prices continue to decline. Silver plunged 20% on Thursday, breaking below $71 per ounce, with the sell-off intensifying on Friday as prices fell further below $64. Compared to the all-time high set on January 29, silver prices have retraced more than 40%, wiping out nearly all gains accumulated over the previous month.
Google Cloud Revenue Surges 48% in Q4 as CapEx Guidance Nearly Doubles: Why the 7.5% After-Hours Dip?
TradingKey - After the close on February 4 (ET), Google (GOOG, GOOGL) released stellar Q4 results: total revenue grew 18% year-over-year, hitting a new quarterly record after revenue first surpassed $100 billion in Q3. The primary highlight was Google Cloud, where Q4 revenue surged 48% year-over-yea
Is Bitcoin’s Four-Year Cycle Dead in 2026?
Is the Bitcoin 4-year cycle dead? After 2025 broke historical records with a red post-halving year, institutional analysts explore if the Bitcoin price has decoupled from the halving countdown. Analyze the impact of spot ETFs, global liquidity, and the roadmap to the 2028 halving in this 2026 market

