

Dow Jones Industrial Average cools off as record rally takes a pause

- The Dow Jones eased down around 200 points on Tuesday.
- Despite an upbeat JOLTS print, equities have eased off their recent rally.
- A packed data docket awaits investors in the runup to Friday’s NFP.
The Dow Jones Industrial Average (DJIA) pared back recent gains again on Tuesday, declining 200 points despite a better-than-expected print in JOLTS Job Openings in October. ADP Employment Change labor preview figures are due on Wednesday, followed by another round of Nonfarm Payrolls (NFP) net jobs additions on Friday.
JOLTS Job Openings rose to 7.744 million job vacancies in October, climbing slightly from September’s revised 7.372 million and beating the expected 7.48 million. A tight US labor market has squeezed JOLTS figures into the low side, declining steadily from multi-year highs of around 12 million set in June of 2022.
ADP Employment Change numbers for November are slated for Wednesday and are expected to decline to 150K from the previous month’s 233K. Friday’s NFP net job additions are expected to rebound to 200K in November after October’s 12K print on the back of temporary job losses attributed to hurricanes, among other things. The US Unemployment Rate is also expected to tick higher to 4.2% from 4.1% on Friday.
South Korea’s conservative President Yoon Suk Yeol declared “emergency martial law” early Tuesday in a surprise move that rattled equities with exposure to South Korean markets. South Korea’s President accused the country’s opposition Democratic Party of sympathizing with North Korea and undermining South Korea’s parliament with anti-state activities.
President Yook Suk Yeol has been embroiled in a fierce battle with the opposition party, which is broadly favored to win the next election in 2027. South Korea’s Democratic Party has been pushing for impeachment articles against top conservative officials in prosecutor positions after President Yoon Suk Yeol rejected calls for investigations into multiple government scandals perpetrated by the South Korean President’s wife and several top officials within the conservative People Power Party.
Dow Jones news
Despite an overall dip in the headline index number, losses are spread around on Tuesday, softening the blow and keeping roughly a third of the Dow Jones’ listed securities in the green. Honeywell (HON) trimmed its yearly earnings outlook after announcing a tech partnership with Canadian aviation manufacturer Bombardier. Honeywell fell 2.2%, declining below $225 per share after investors balked at the cash outlay as part of the Bombardier deal that will crimp earnings for the year.
Dow Jones price forecast
The Dow Jones is paring back recent gains into record highs as bulls take a breather. The major equity index is easing back toward 44,500 after tapping a new all-time peak above 45,000 last week. Despite a near-term pivot into the downside shaping up, short positioning buildup hasn’t paid off very well in 2024: November was the Dow Jones’ best single-month performance in exactly a year, gaining 7.6% in just four weeks, and the Dow closed higher for all but of the last twelve consecutive months.
The 50-day Exponential Moving Average (EMA) is rising into 43,200, providing an immediate technical floor along with the last swing low on daily candlesticks in the same region. Prices have outrun the 200-day EMA since November of last year, and the Dow Jones is up over 18% YTD.
Dow Jones daily chart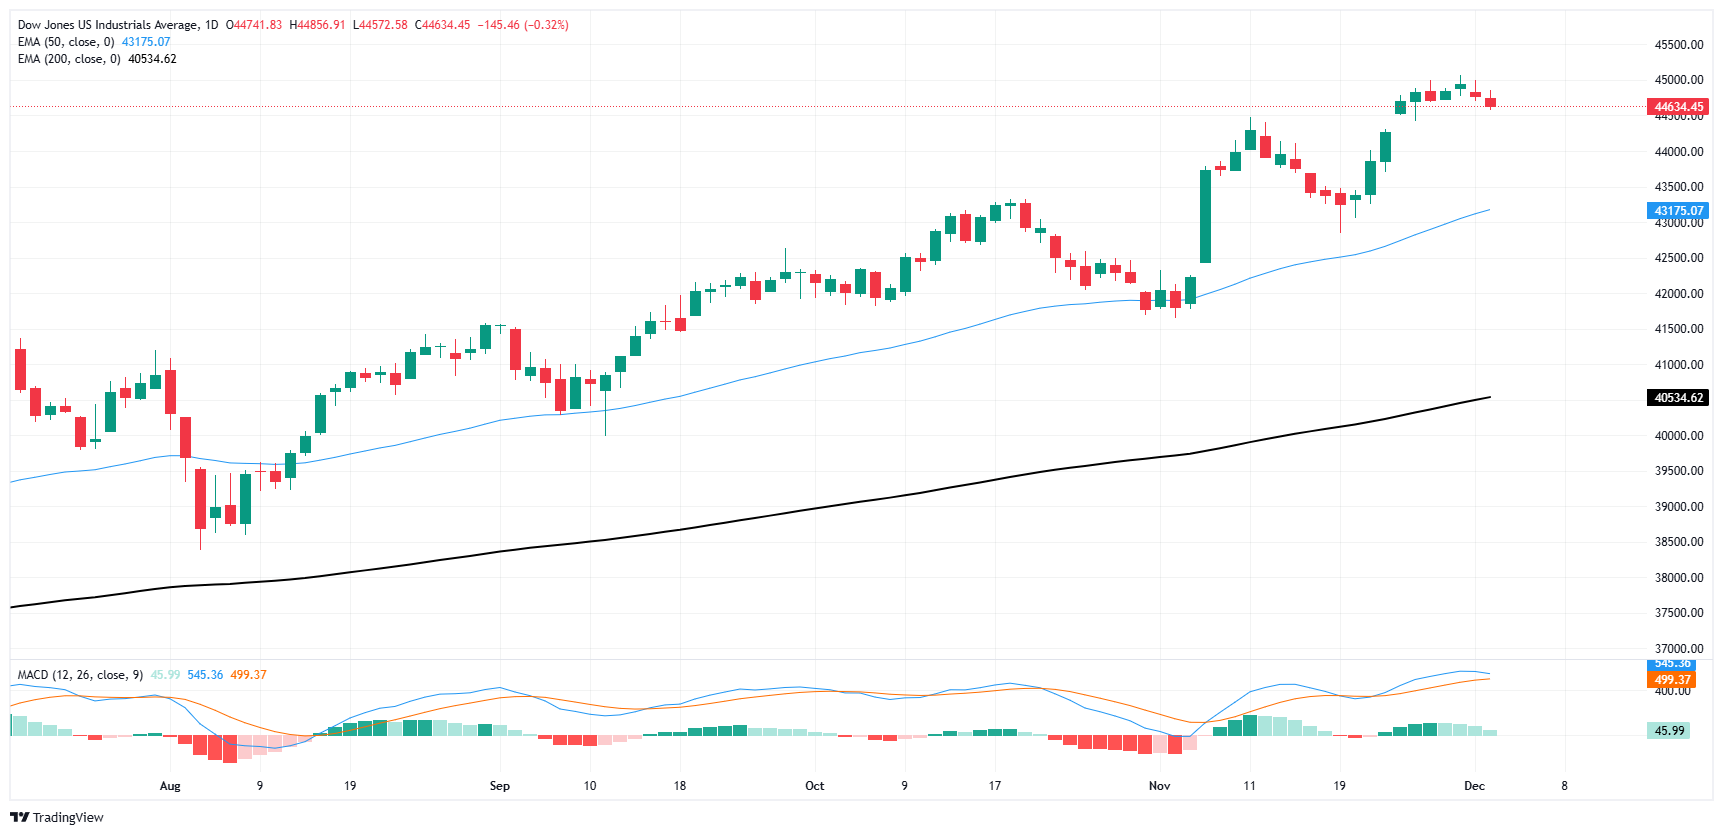
Dow Jones FAQs
The Dow Jones Industrial Average, one of the oldest stock market indices in the world, is compiled of the 30 most traded stocks in the US. The index is price-weighted rather than weighted by capitalization. It is calculated by summing the prices of the constituent stocks and dividing them by a factor, currently 0.152. The index was founded by Charles Dow, who also founded the Wall Street Journal. In later years it has been criticized for not being broadly representative enough because it only tracks 30 conglomerates, unlike broader indices such as the S&P 500.
Many different factors drive the Dow Jones Industrial Average (DJIA). The aggregate performance of the component companies revealed in quarterly company earnings reports is the main one. US and global macroeconomic data also contributes as it impacts on investor sentiment. The level of interest rates, set by the Federal Reserve (Fed), also influences the DJIA as it affects the cost of credit, on which many corporations are heavily reliant. Therefore, inflation can be a major driver as well as other metrics which impact the Fed decisions.
Dow Theory is a method for identifying the primary trend of the stock market developed by Charles Dow. A key step is to compare the direction of the Dow Jones Industrial Average (DJIA) and the Dow Jones Transportation Average (DJTA) and only follow trends where both are moving in the same direction. Volume is a confirmatory criteria. The theory uses elements of peak and trough analysis. Dow’s theory posits three trend phases: accumulation, when smart money starts buying or selling; public participation, when the wider public joins in; and distribution, when the smart money exits.
There are a number of ways to trade the DJIA. One is to use ETFs which allow investors to trade the DJIA as a single security, rather than having to buy shares in all 30 constituent companies. A leading example is the SPDR Dow Jones Industrial Average ETF (DIA). DJIA futures contracts enable traders to speculate on the future value of the index and Options provide the right, but not the obligation, to buy or sell the index at a predetermined price in the future. Mutual funds enable investors to buy a share of a diversified portfolio of DJIA stocks thus providing exposure to the overall index.
Related Articles
Amazon Stock Predictions for 2026 to 2030: Will They Exceed Expectations and Achieve Major Long-Term Goals?
TradingKey - As we head into 2026, many investors are questioning where Amazon (AMZN) fits into the technology world.
A Crash After a Surge: Why Silver Lost 40% in a Week?
TradingKey - Spot silver (XAGUSD) prices continue to decline. Silver plunged 20% on Thursday, breaking below $71 per ounce, with the sell-off intensifying on Friday as prices fell further below $64. Compared to the all-time high set on January 29, silver prices have retraced more than 40%, wiping out nearly all gains accumulated over the previous month.
Google Cloud Revenue Surges 48% in Q4 as CapEx Guidance Nearly Doubles: Why the 7.5% After-Hours Dip?
TradingKey - After the close on February 4 (ET), Google (GOOG, GOOGL) released stellar Q4 results: total revenue grew 18% year-over-year, hitting a new quarterly record after revenue first surpassed $100 billion in Q3. The primary highlight was Google Cloud, where Q4 revenue surged 48% year-over-yea
Is Bitcoin’s Four-Year Cycle Dead in 2026?
Is the Bitcoin 4-year cycle dead? After 2025 broke historical records with a red post-halving year, institutional analysts explore if the Bitcoin price has decoupled from the halving countdown. Analyze the impact of spot ETFs, global liquidity, and the roadmap to the 2028 halving in this 2026 market

