

US Dollar supported as markets cool down Fed’s rate cut cycle prospects

- The US Dollar consolidates Monday’s gains after a grind higher to a fresh 11-week high.
- US equities retrace from all-time highs as the Fed might not cut that much as first anticipated.
- The US Dollar index trades in a tight range on Tuesday after failing to break above 104.00.
The US Dollar (USD) slightly retraces on Tuesday following a small sprint higher on Monday that drove the US Dollar Index (DXY), which gauges Greenback’s value against six major currencies, to a fresh 11-week high after US equities retreated from their all-time highs. The US Treasury bonds are starting to sell off as well as it appears that markets are starting to reprice their interest rate cut expectations, with rising probabilities that the Federal Reserve (Fed) only set to cut once more this year before going into a wait-and-see mode.
On the US economic front, a very light calendar is ahead for markets to digest on Tuesday. One takeaway, though, comes from the Fed speakers as there is a clear dispersion in opinions within the Federal Open Market Committee (FOMC), as Atlanta Fed President Raphael Bostic pleaded for no rate cuts anymore this year while San Francisco Fed President Mary Daly commented on Monday that the Fed needs to go ahead with its rate cutting cycle and ease further. Market participants are intrigued to see what Philadelphia Fed President Patrick Harker thinks about the matter this Tuesday around 14:00 GMT.
Daily digest market movers: Fed is becoming dispersed
- At 14:00 GMT, Federal Reserve Bank of Philadelphia President Patrick Harker delivers opening remarks at the Eight Annual Fintech Conference Hosted by the Federal Reserve Bank of Philadelphia.
- While Harker will deliver his speech, the Richmond Fed Manufacturing Index for October will be released at 14:00 GMT. Analysts expect the number to remain in contraction at -18, a touch better than the -21 in September.
- Asian equities are sluggish again, with Japan’s main indices having closed over -1% lower. European equities are flat to marginally higher, while US equity futures are marginally in the red.
- The CME Fedwatch Tool is still backing a small 25 basis point (bps) rate cut with an 87.0% probability against a 13.0% chance of no rate cut for the upcoming Fed meeting on November 7.
- The US 10-year benchmark rate trades at 4.20% and rallied substantially on Monday while bonds were selling off. Note that when bond prices fall, the inverted yield increases.
US Dollar Index Technical Analysis: Burning fingers
The US Dollar Index (DXY) trades between two firm levels on Tuesday after breaking through a bearish fortress, which came in the form of the 200-day Simple Moving Average (SMA) at 103.80 on Monday. Unfortunately, the 103.99/104.00 level was too heavy to break through at the first attempt. Should markets price in lesser interest rate cuts from the Fed, expect to see a 105.00 appear rather quickly in the US Dollar Index.
Ver closeby on the upside, the 103.99/104.00 level triggered a rejection on Monday and continues as resistance on Tuesday. Once that level breaks, look for the 105.00 round level and even 105.53 (the April 11 high) in a quick sprint higher. More upside would see some resistances near 105.89 (the May 2 high and descending trendline) before considering 106.00.
On the downside, the 200-day SMA is very strong support due to a test at 103.80. Look out for false breaks, and consider waiting for a daily close below that level when reassessing if there will be more downside for the DXY. The next big support is a double one, with the 100-day SMA at 103.19 together with the pivotal 103.18 level (the March 12 high). If that level breaks, a big gap lower would occur to the 101.90 support zone, with the 55-day SMA at 101.89.
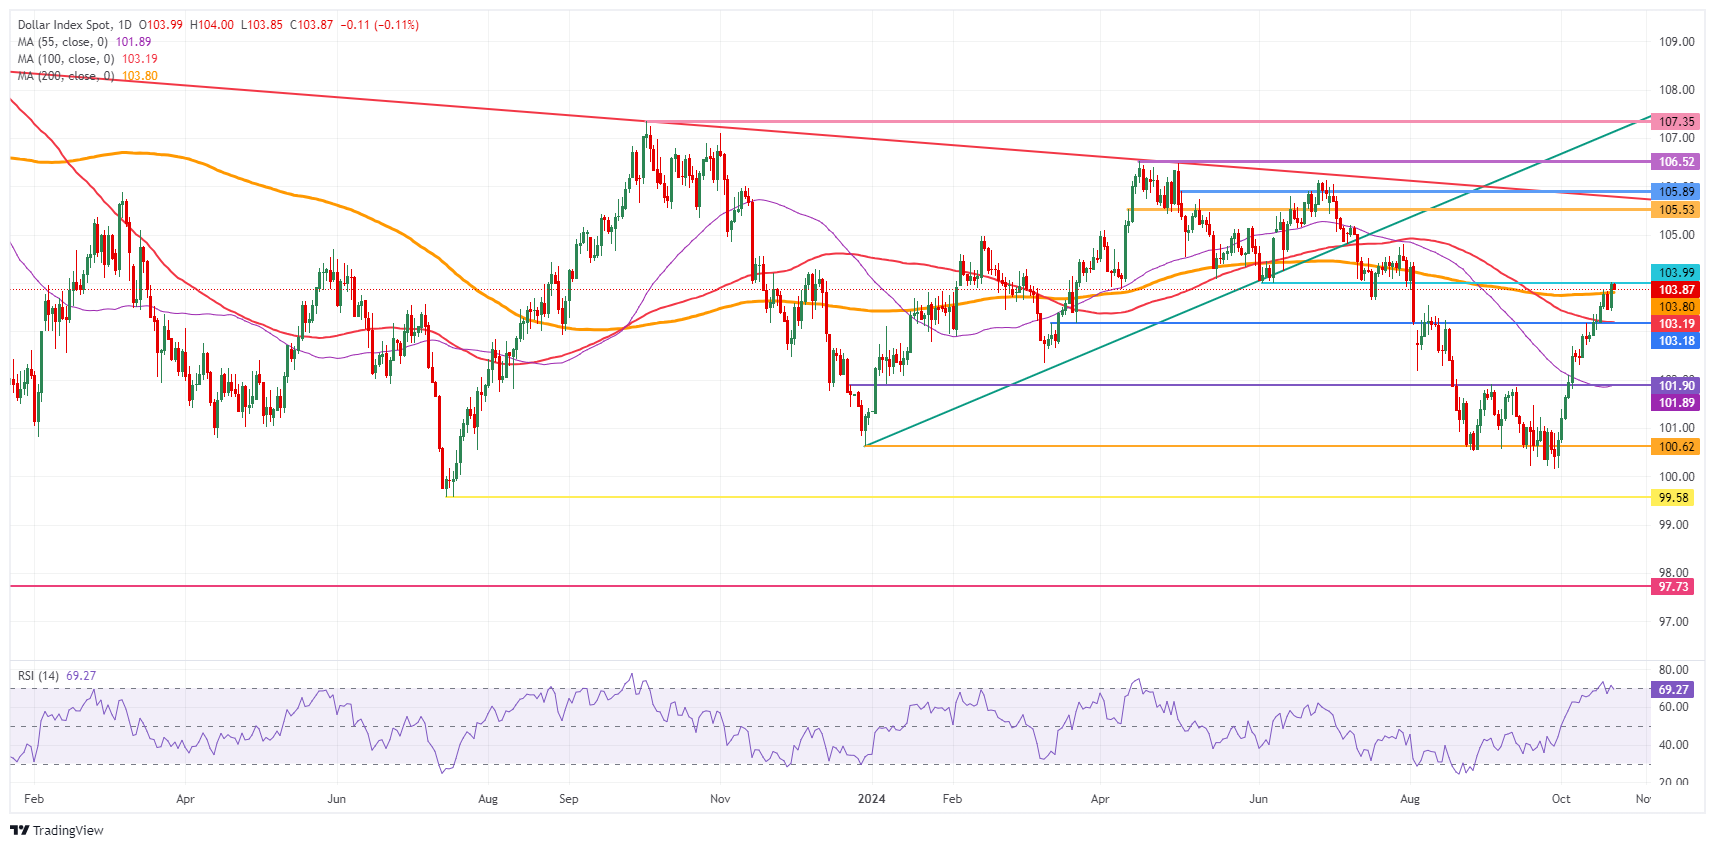
US Dollar Index: Daily Chart
US Dollar FAQs
The US Dollar (USD) is the official currency of the United States of America, and the ‘de facto’ currency of a significant number of other countries where it is found in circulation alongside local notes. It is the most heavily traded currency in the world, accounting for over 88% of all global foreign exchange turnover, or an average of $6.6 trillion in transactions per day, according to data from 2022. Following the second world war, the USD took over from the British Pound as the world’s reserve currency. For most of its history, the US Dollar was backed by Gold, until the Bretton Woods Agreement in 1971 when the Gold Standard went away.
The most important single factor impacting on the value of the US Dollar is monetary policy, which is shaped by the Federal Reserve (Fed). The Fed has two mandates: to achieve price stability (control inflation) and foster full employment. Its primary tool to achieve these two goals is by adjusting interest rates. When prices are rising too quickly and inflation is above the Fed’s 2% target, the Fed will raise rates, which helps the USD value. When inflation falls below 2% or the Unemployment Rate is too high, the Fed may lower interest rates, which weighs on the Greenback.
In extreme situations, the Federal Reserve can also print more Dollars and enact quantitative easing (QE). QE is the process by which the Fed substantially increases the flow of credit in a stuck financial system. It is a non-standard policy measure used when credit has dried up because banks will not lend to each other (out of the fear of counterparty default). It is a last resort when simply lowering interest rates is unlikely to achieve the necessary result. It was the Fed’s weapon of choice to combat the credit crunch that occurred during the Great Financial Crisis in 2008. It involves the Fed printing more Dollars and using them to buy US government bonds predominantly from financial institutions. QE usually leads to a weaker US Dollar.
Quantitative tightening (QT) is the reverse process whereby the Federal Reserve stops buying bonds from financial institutions and does not reinvest the principal from the bonds it holds maturing in new purchases. It is usually positive for the US Dollar.
Related Articles
Amazon Stock Predictions for 2026 to 2030: Will They Exceed Expectations and Achieve Major Long-Term Goals?
TradingKey - As we head into 2026, many investors are questioning where Amazon (AMZN) fits into the technology world.
A Crash After a Surge: Why Silver Lost 40% in a Week?
TradingKey - Spot silver (XAGUSD) prices continue to decline. Silver plunged 20% on Thursday, breaking below $71 per ounce, with the sell-off intensifying on Friday as prices fell further below $64. Compared to the all-time high set on January 29, silver prices have retraced more than 40%, wiping out nearly all gains accumulated over the previous month.
Is Bitcoin’s Four-Year Cycle Dead in 2026?
Is the Bitcoin 4-year cycle dead? After 2025 broke historical records with a red post-halving year, institutional analysts explore if the Bitcoin price has decoupled from the halving countdown. Analyze the impact of spot ETFs, global liquidity, and the roadmap to the 2028 halving in this 2026 market
USD Dollar Trend Forecast: Dollar Index Falls Below 97.0 to 4-Year Low, Will the Dollar Continue To Fall or Bottom Out in 2026?
TradingKey - In January 2026, the US Dollar Index continued its downward trend from 2025, officially breaking below the key 97.0 level and reaching a low of 95.5, marking a nearly four-year low since February 2022.

