

US Dollar steady ahead of US PPI and Michigan release

- The US Dollar trades flat on Friday, set to close the week with gains.
- Traders are gearing up for US PPI while Fed speakers keep reiterating rate cuts are to come.
- The US Dollar Index trades above 102.50 and struggles to break above 103.00.
The US Dollar (USD) stabilizes on Friday after a very solid rally this week, with the rate differential becoming the main driver. The question going forward for next week will be if this upward move in US Treasury rates was a bit overdone, seeing the US Consumer Price Index (CPI) only marginally ticked up in September compared to the previous month. This contradicts what several Federal Reserve (Fed) officials have said this week, that US rates will go lower with more interest rate cuts from the Fed confirmed.
The economic calendar is facing this week's last pieces of the puzzle. The US Producer Price Index (PPI) release for September will reveal whether the uptick in inflation is also noticeable on the production side. The last data point will be the preliminary reading from the University of Michigan on Consumer Sentiment and inflation expectations for October.
Daily digest market movers: Michigan could get distorted
- At 12:30 GMT, the US Producer Price Index numbers for September are released:
- The monthly headline PPI is expected to increase by 0.1.% from 0.2% in the previous month, with core PPI facing a similar move down to 0.2% from 0.3% previous.
- The yearly headline PPI inflation is expected to tick down to 1.6%, coming from 1.7% in August. The core PPI will be an outlier and is expected to rise 2.7%, coming from 2.4%.
- At 14:00 GMT, the University of Michigan preliminary reading for October will be released:
- Consumer Sentiment is expected to head higher to 70.8, coming from 70.1.
- 5-year consumer inflation expectations were at 3.1% in September, with no forecast available.
- The readings could be distorted due to the hurricanes in the South of the US.
- There are a few Fed speakers to look out for on Friday:
- At 13:45 GMT, Austan D. Goolsbee, head of the Federal Reserve Bank of Chicago, gives opening remarks at the Community Bankers Symposium.
- At 17:10 GMT, Federal Reserve Governor Michelle Bowman (2024 FOMC voting member) delivers a virtual speech about community banking at the Federal Reserve Bank of Chicago Community Bankers Symposium.
- Equities are overall dispersed this Friday, with main European indices on the downside, while US futures are flat to lower.
- The CME Fedwatch Tool shows an 84.0% chance of a 25 bps interest rate cut at the next Fed meeting on November 7, while 16.0% is pricing in no rate cut. Chances for a 50 bps rate cut have been fully priced out now.
- The US 10-year benchmark rate trades at 4.09, afloat above 4%.
US Dollar Index Technical Analysis: Here it gets tricky
The US Dollar Index (DXY) has had a quick sprint higher this week, with markets repositioning in the idea that interest rate cuts might be a certainty for the remainder of 2024. Although Fed officials are still very vocal on more rate cuts to come, the current move in US Treasury rates does not match with that message from the Fed. Either markets completely price out any rate cuts for 2024, which would mean the DXY break above 103.00, or it fades from here with US rates falling lower.
The psychological 103.00 is the first level to tackle on the upside. Further up, the chart identifies 103.18 as the very final resistance level for this week. Once above there, a very choppy area emerges, with the 100-day Simple Moving Average (SMA) at 103.26, the 200-day SMA at 103.77, and the pivotal 103.99-104.00 levels in play.
On the downside, the 55-day SMA at 101.91 is the first line of defence, backed by the 102.00 round level and the pivotal 101.90 as support to catch any bearish pressure and trigger a bounce. If that level does not work out, 100.62 also acts as support. Further down, a test of the year-to-date low of 100.16 should take place before more downside. Finally, and that means giving up the big 100.00 level, the July 14, 2023, low at 99.58 comes into play.
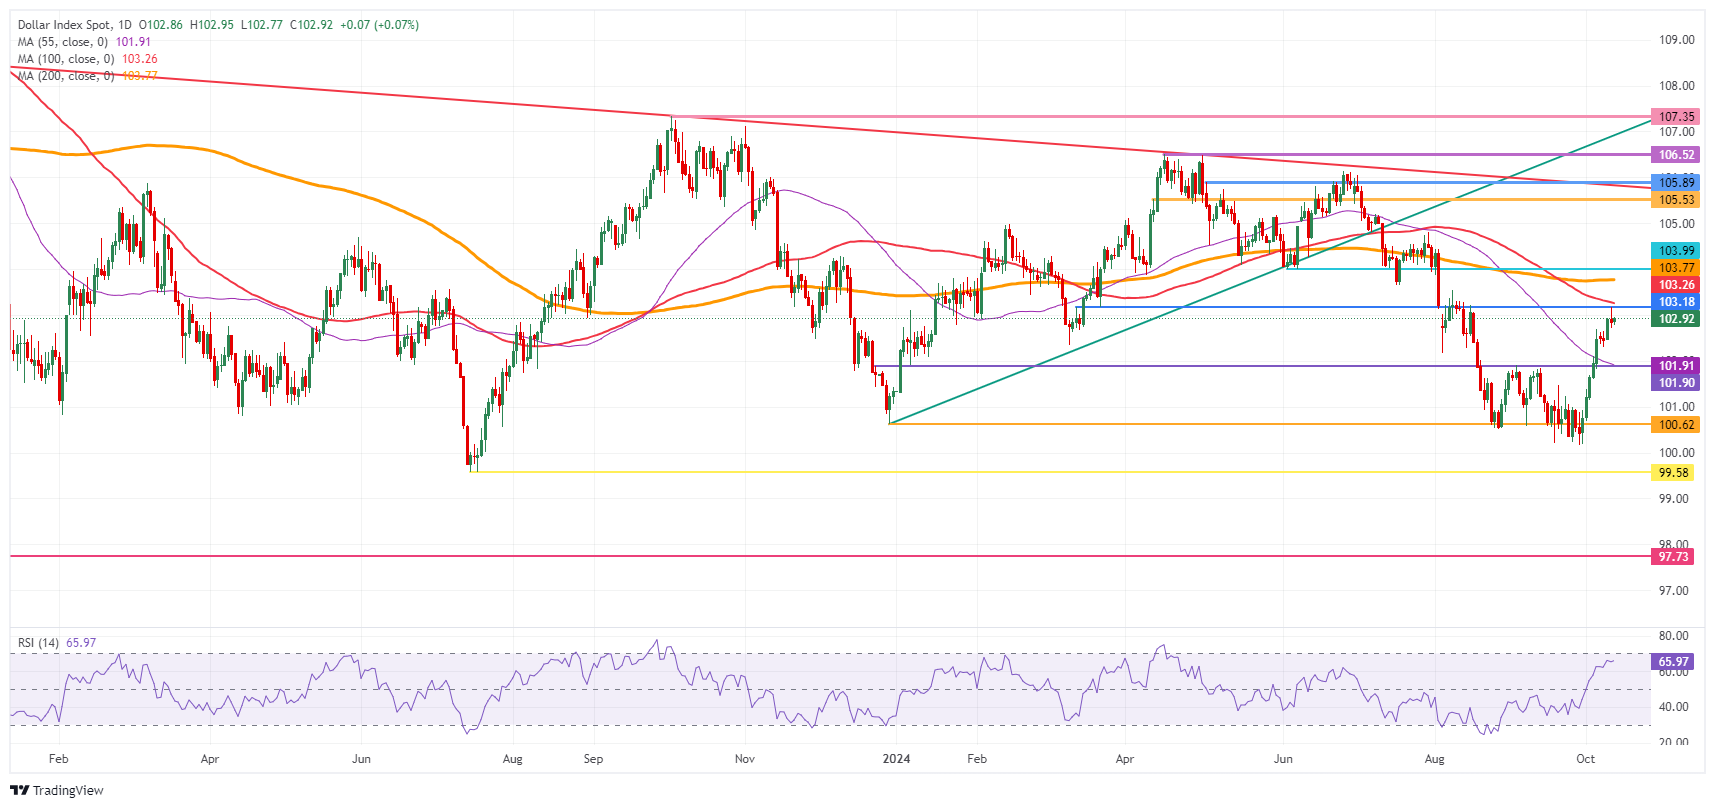
US Dollar Index: Daily Chart
US Dollar FAQs
The US Dollar (USD) is the official currency of the United States of America, and the ‘de facto’ currency of a significant number of other countries where it is found in circulation alongside local notes. It is the most heavily traded currency in the world, accounting for over 88% of all global foreign exchange turnover, or an average of $6.6 trillion in transactions per day, according to data from 2022. Following the second world war, the USD took over from the British Pound as the world’s reserve currency. For most of its history, the US Dollar was backed by Gold, until the Bretton Woods Agreement in 1971 when the Gold Standard went away.
The most important single factor impacting on the value of the US Dollar is monetary policy, which is shaped by the Federal Reserve (Fed). The Fed has two mandates: to achieve price stability (control inflation) and foster full employment. Its primary tool to achieve these two goals is by adjusting interest rates. When prices are rising too quickly and inflation is above the Fed’s 2% target, the Fed will raise rates, which helps the USD value. When inflation falls below 2% or the Unemployment Rate is too high, the Fed may lower interest rates, which weighs on the Greenback.
In extreme situations, the Federal Reserve can also print more Dollars and enact quantitative easing (QE). QE is the process by which the Fed substantially increases the flow of credit in a stuck financial system. It is a non-standard policy measure used when credit has dried up because banks will not lend to each other (out of the fear of counterparty default). It is a last resort when simply lowering interest rates is unlikely to achieve the necessary result. It was the Fed’s weapon of choice to combat the credit crunch that occurred during the Great Financial Crisis in 2008. It involves the Fed printing more Dollars and using them to buy US government bonds predominantly from financial institutions. QE usually leads to a weaker US Dollar.
Quantitative tightening (QT) is the reverse process whereby the Federal Reserve stops buying bonds from financial institutions and does not reinvest the principal from the bonds it holds maturing in new purchases. It is usually positive for the US Dollar.
Related Articles
Amazon Stock Predictions for 2026 to 2030: Will They Exceed Expectations and Achieve Major Long-Term Goals?
TradingKey - As we head into 2026, many investors are questioning where Amazon (AMZN) fits into the technology world.
A Crash After a Surge: Why Silver Lost 40% in a Week?
TradingKey - Spot silver (XAGUSD) prices continue to decline. Silver plunged 20% on Thursday, breaking below $71 per ounce, with the sell-off intensifying on Friday as prices fell further below $64. Compared to the all-time high set on January 29, silver prices have retraced more than 40%, wiping out nearly all gains accumulated over the previous month.
Google Cloud Revenue Surges 48% in Q4 as CapEx Guidance Nearly Doubles: Why the 7.5% After-Hours Dip?
TradingKey - After the close on February 4 (ET), Google (GOOG, GOOGL) released stellar Q4 results: total revenue grew 18% year-over-year, hitting a new quarterly record after revenue first surpassed $100 billion in Q3. The primary highlight was Google Cloud, where Q4 revenue surged 48% year-over-yea
Is Bitcoin’s Four-Year Cycle Dead in 2026?
Is the Bitcoin 4-year cycle dead? After 2025 broke historical records with a red post-halving year, institutional analysts explore if the Bitcoin price has decoupled from the halving countdown. Analyze the impact of spot ETFs, global liquidity, and the roadmap to the 2028 halving in this 2026 market

