

US Dollar nears yearly lows with investors storming into Asian markets

- The US Dollar is under pressure after investors are relocating investments.
- Recession fears are emerging again for the US after a batch of weak economic data.
- The US Dollar Index flirts with a fresh 15-month low and could slip below 100.00 if more selling pressure occurs.
The US Dollar (USD) trades flat in the early European session on Wednesday after easing against most major Asian currencies, such as the Chinese Yuan (CNY) or the Indian Rupee (INR), overnight. The reshuffle comes after investors relocate their investments from the US to Chinese equities. The move is triggered by a massive stimulus plan from the Chinese government that was implemented on Tuesday.
On the economic data front, there is a very light calendar ahead, with no real market-moving data on Wednesday. One element that might draw some attention is comments from Federal Reserve (Fed) Governor Adriana Kugler, who delivers a speech about the US economic outlook at the Harvard Kennedy School in Cambridge, Massachusetts. From there, markets will be on edge over the US Q2 Gross Domestic Product (GDP) release, and Fed Chairman Jerome Powell set to speak on Thursday.
Daily digest market movers: Expect some calmness
- “Sentiment is firing up in Asian markets after China announced a raft of policy stimulus measures,” damping demand for the Dollar, said Wei Liang Chang, a foreign exchange and credit strategist at DBS Bank in Singapore, Bloomberg reports.
- At 11:00 GMT, the Mortgage Bankers Association (MBA) released its weekly mortgage applications index. There was a surge of 11.0% in applications against 14.2% last week.
- Related to mortgages, New Home Sales are due at 14:00 GMT. Expectations are for a touch softer number at 0.700 million units in August against 0.739 million previously.
- The US Treasury will allocate a 5-year Note around 17:00 GMT.
- At 20:00 GMT, Federal Reserve Governor Adriana Kugler delivers a speech about the US economic outlook at the Harvard Kennedy School in Cambridge, Massachusetts.
- All equity markets are in the red, except for the Chinese equities which are rallying for a second day, supported by the Chinese stimulus measures.
- The CME Fedwatch Tool shows a 41.6% chance of a 25-basis-point rate cut at the next Fed meeting on November 7, while 58.4% is pricing in another 50-basis-point rate cut.
- The US 10-year benchmark rate trades at 3.73%, retreating from its attempt earlier to print a fresh monthly high.
US Dollar Index Technical Analysis: There is the catch up with reality
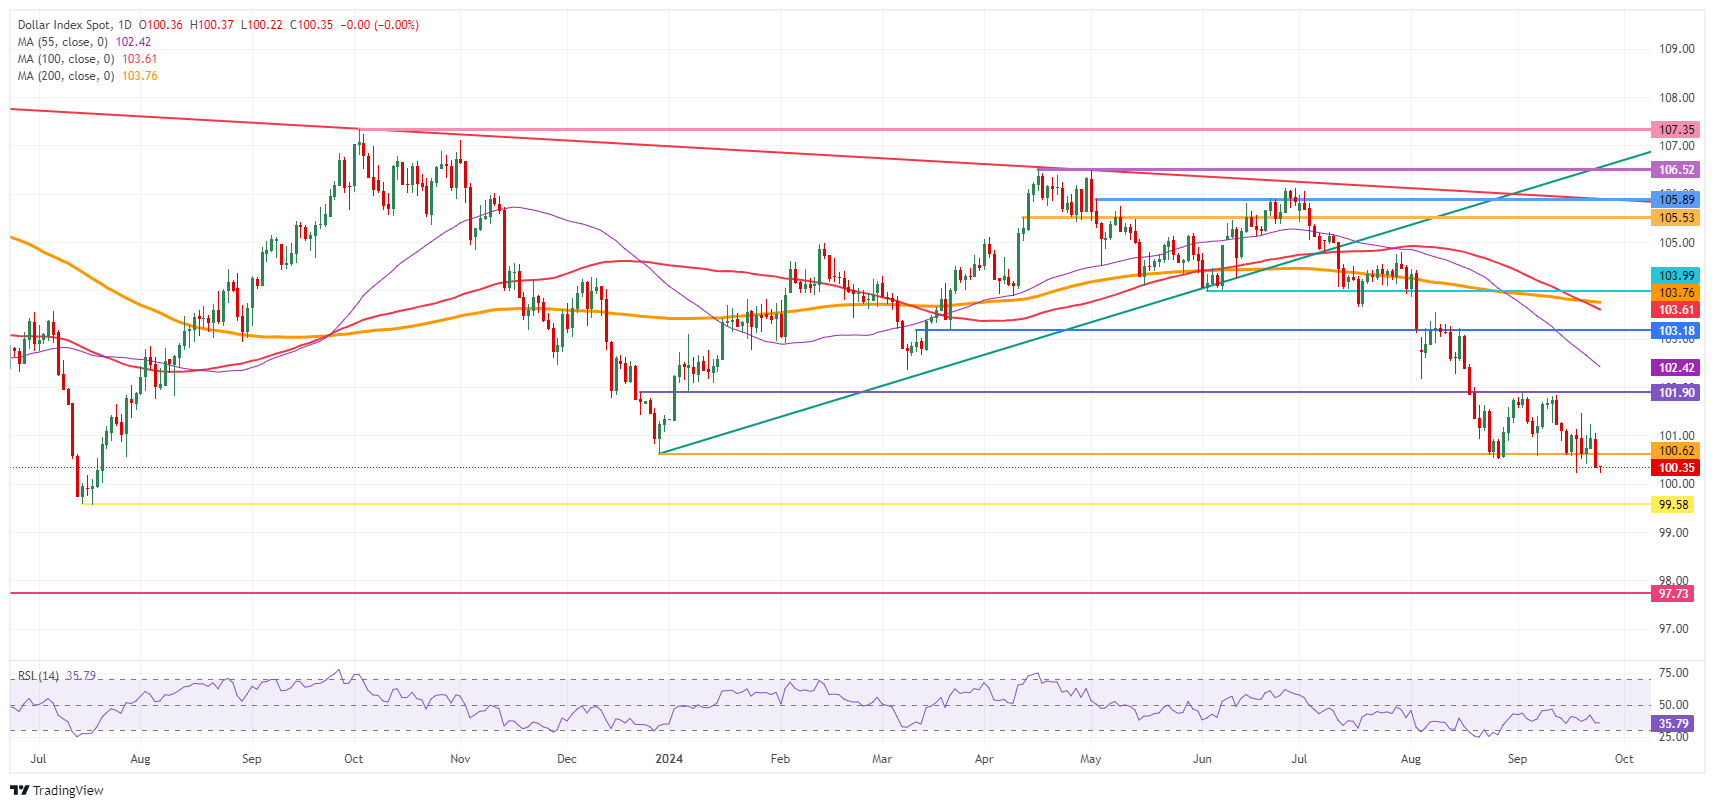
The US Dollar Index (DXY) is flirting with a fresh 15-month low after Tuesday’s data and China stimulus triggered some further devaluation for the Greenback. Going forward, rather the main data on Thursday and Friday will act as catalysts that might move the DXY. Watch out for the US Q2 Gross Domestic Product (GDP), that could trigger recession fears in case it drops.
The upper level of the September range remains at 101.90. Further up, the index could go to 103.18, with the 55-day Simple Moving Average (SMA) at 102.42 along the way. The next tranche up is very misty, with the 100-day SMA at 103.61 and the 200-day SMA at 103.76, just ahead of the big 104.00 round level.
On the downside, 100.22 (the September 18 low) is the first support, and a break could point to more weakness ahead. Should that take place, the low from July 14, 2023, at 99.58, will be the next level to look out for. If that level gives way, early levels from 2023 are coming in near 97.73.
US Dollar Index: Daily Chart
US Dollar FAQs
The US Dollar (USD) is the official currency of the United States of America, and the ‘de facto’ currency of a significant number of other countries where it is found in circulation alongside local notes. It is the most heavily traded currency in the world, accounting for over 88% of all global foreign exchange turnover, or an average of $6.6 trillion in transactions per day, according to data from 2022. Following the second world war, the USD took over from the British Pound as the world’s reserve currency. For most of its history, the US Dollar was backed by Gold, until the Bretton Woods Agreement in 1971 when the Gold Standard went away.
The most important single factor impacting on the value of the US Dollar is monetary policy, which is shaped by the Federal Reserve (Fed). The Fed has two mandates: to achieve price stability (control inflation) and foster full employment. Its primary tool to achieve these two goals is by adjusting interest rates. When prices are rising too quickly and inflation is above the Fed’s 2% target, the Fed will raise rates, which helps the USD value. When inflation falls below 2% or the Unemployment Rate is too high, the Fed may lower interest rates, which weighs on the Greenback.
In extreme situations, the Federal Reserve can also print more Dollars and enact quantitative easing (QE). QE is the process by which the Fed substantially increases the flow of credit in a stuck financial system. It is a non-standard policy measure used when credit has dried up because banks will not lend to each other (out of the fear of counterparty default). It is a last resort when simply lowering interest rates is unlikely to achieve the necessary result. It was the Fed’s weapon of choice to combat the credit crunch that occurred during the Great Financial Crisis in 2008. It involves the Fed printing more Dollars and using them to buy US government bonds predominantly from financial institutions. QE usually leads to a weaker US Dollar.
Quantitative tightening (QT) is the reverse process whereby the Federal Reserve stops buying bonds from financial institutions and does not reinvest the principal from the bonds it holds maturing in new purchases. It is usually positive for the US Dollar.
Related Articles
Amazon Stock Predictions for 2026 to 2030: Will They Exceed Expectations and Achieve Major Long-Term Goals?
TradingKey - As we head into 2026, many investors are questioning where Amazon (AMZN) fits into the technology world.
A Crash After a Surge: Why Silver Lost 40% in a Week?
TradingKey - Spot silver (XAGUSD) prices continue to decline. Silver plunged 20% on Thursday, breaking below $71 per ounce, with the sell-off intensifying on Friday as prices fell further below $64. Compared to the all-time high set on January 29, silver prices have retraced more than 40%, wiping out nearly all gains accumulated over the previous month.
Google Cloud Revenue Surges 48% in Q4 as CapEx Guidance Nearly Doubles: Why the 7.5% After-Hours Dip?
TradingKey - After the close on February 4 (ET), Google (GOOG, GOOGL) released stellar Q4 results: total revenue grew 18% year-over-year, hitting a new quarterly record after revenue first surpassed $100 billion in Q3. The primary highlight was Google Cloud, where Q4 revenue surged 48% year-over-yea
Is Bitcoin’s Four-Year Cycle Dead in 2026?
Is the Bitcoin 4-year cycle dead? After 2025 broke historical records with a red post-halving year, institutional analysts explore if the Bitcoin price has decoupled from the halving countdown. Analyze the impact of spot ETFs, global liquidity, and the roadmap to the 2028 halving in this 2026 market

