US Dollar Index Price Forecast: The bearish vibe prevails below 100.50

- The US Dollar Index softens around 100.35 in Wednesday’s early European session.
- The negative outlook of the index prevails below the key 100-day EMA, with the bearish RSI indicator.
- The initial support level emerges at 100.25; the first upside barrier is seen at 101.23.
The US Dollar Index (DXY) remains on the defensive near 100.35 during the early European session on Wednesday. The improved risk appetite following the fresh Chinese stimulus plans and rising bets on a jumbo interest rate reduction from the US Federal Reserve (Fed) in November weigh on the DXY. The US New Home Sales data for August will be published later on Wednesday. Traders also await the Fed’s Governor Adriana Kugler speech for fresh impetus.
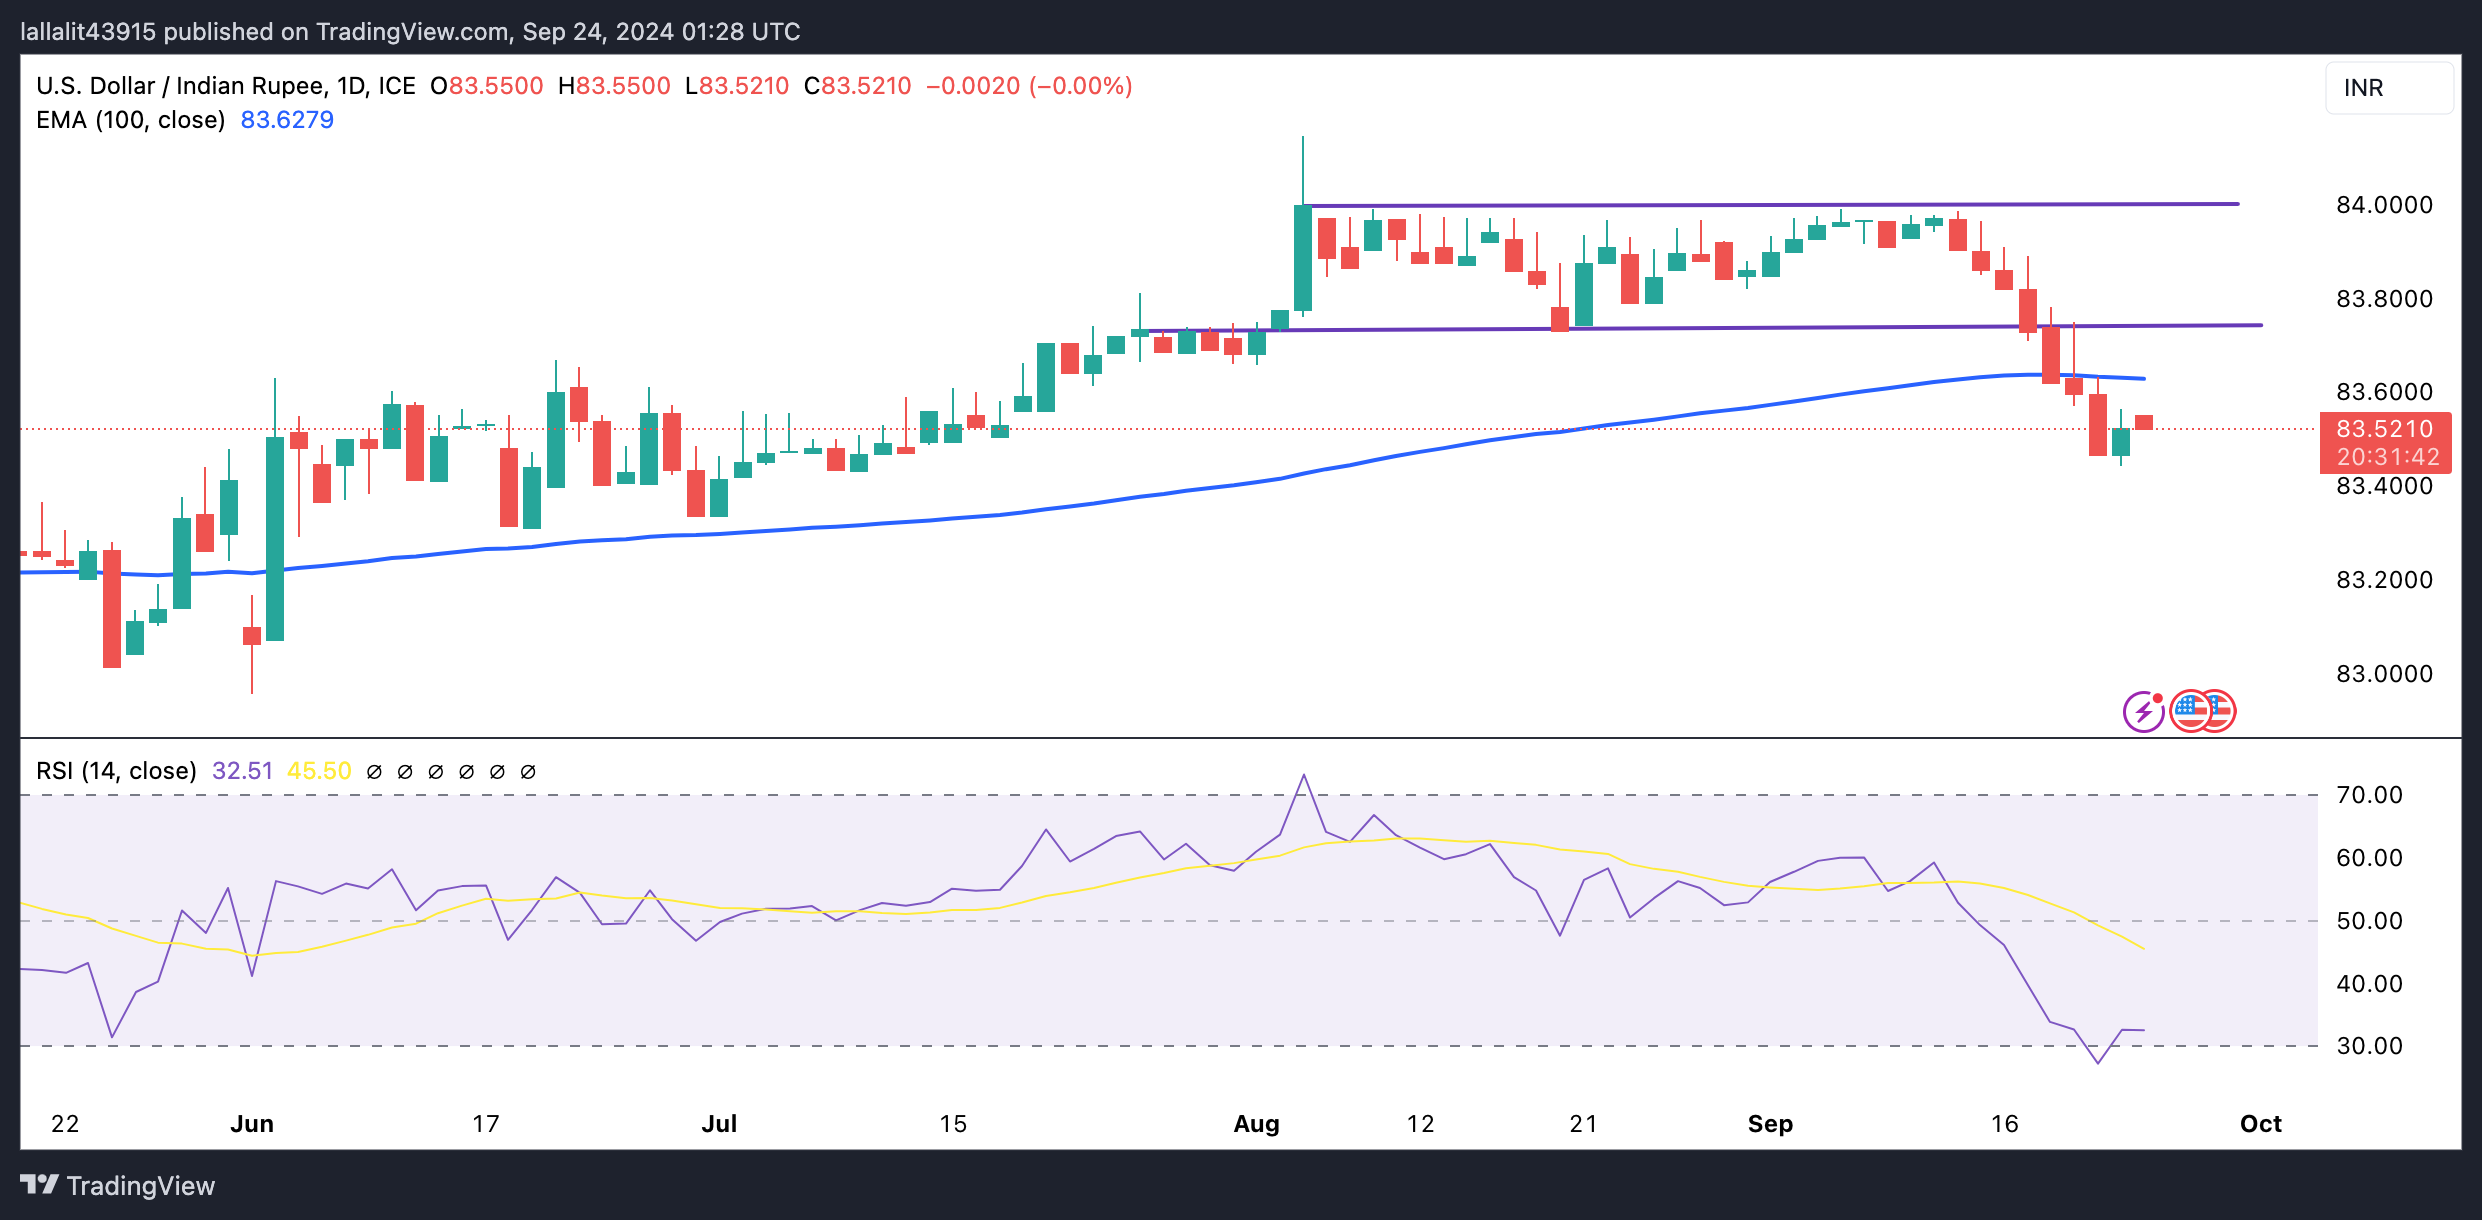
Technically, the DXY keeps the bearish vibe on the daily chart as the index holds below the key 100-day Exponential Moving Averages (EMA). The downward momentum is supported by the Relative Strength Index (RSI), which stands below the midline near 35.65. This suggests that further downside of DXY looks favorable.
A decisive break below the lower limit of the Bollinger Band at 100.25 could expose the 100.00 psychological mark. Extended losses could see a drop to 99.74, the low of July 13, 2023. The additional downside filter to watch is 99.57, the low of July 18, 2023.
On the bright side, the high of September 23 at 101.23 acts as an immediate resistance level for the US Dollar Index. Further north, the next upside barrier is seen at 101.84, the high of September 12. The round level and the upper boundary of Bollinger Band in the 102.00-102.05 zone appear to be a tough nut to crack for DXY bulls. A break above the mentioned level could see a rally to the 100-day EMA at 102.95.
US Dollar Index (DXY) Daily Chart
US Dollar FAQs
The US Dollar (USD) is the official currency of the United States of America, and the ‘de facto’ currency of a significant number of other countries where it is found in circulation alongside local notes. It is the most heavily traded currency in the world, accounting for over 88% of all global foreign exchange turnover, or an average of $6.6 trillion in transactions per day, according to data from 2022. Following the second world war, the USD took over from the British Pound as the world’s reserve currency. For most of its history, the US Dollar was backed by Gold, until the Bretton Woods Agreement in 1971 when the Gold Standard went away.
The most important single factor impacting on the value of the US Dollar is monetary policy, which is shaped by the Federal Reserve (Fed). The Fed has two mandates: to achieve price stability (control inflation) and foster full employment. Its primary tool to achieve these two goals is by adjusting interest rates. When prices are rising too quickly and inflation is above the Fed’s 2% target, the Fed will raise rates, which helps the USD value. When inflation falls below 2% or the Unemployment Rate is too high, the Fed may lower interest rates, which weighs on the Greenback.
In extreme situations, the Federal Reserve can also print more Dollars and enact quantitative easing (QE). QE is the process by which the Fed substantially increases the flow of credit in a stuck financial system. It is a non-standard policy measure used when credit has dried up because banks will not lend to each other (out of the fear of counterparty default). It is a last resort when simply lowering interest rates is unlikely to achieve the necessary result. It was the Fed’s weapon of choice to combat the credit crunch that occurred during the Great Financial Crisis in 2008. It involves the Fed printing more Dollars and using them to buy US government bonds predominantly from financial institutions. QE usually leads to a weaker US Dollar.
Quantitative tightening (QT) is the reverse process whereby the Federal Reserve stops buying bonds from financial institutions and does not reinvest the principal from the bonds it holds maturing in new purchases. It is usually positive for the US Dollar.
Related Articles
Amazon Stock Predictions for 2026 to 2030: Will They Exceed Expectations and Achieve Major Long-Term Goals?
TradingKey - As we head into 2026, many investors are questioning where Amazon (AMZN) fits into the technology world.
A Crash After a Surge: Why Silver Lost 40% in a Week?
TradingKey - Spot silver (XAGUSD) prices continue to decline. Silver plunged 20% on Thursday, breaking below $71 per ounce, with the sell-off intensifying on Friday as prices fell further below $64. Compared to the all-time high set on January 29, silver prices have retraced more than 40%, wiping out nearly all gains accumulated over the previous month.
Is Bitcoin’s Four-Year Cycle Dead in 2026?
Is the Bitcoin 4-year cycle dead? After 2025 broke historical records with a red post-halving year, institutional analysts explore if the Bitcoin price has decoupled from the halving countdown. Analyze the impact of spot ETFs, global liquidity, and the roadmap to the 2028 halving in this 2026 market
Disney Trend Forecast: Disney FY26 First Quarter Net Profit Falls 6% Stock Price Slumps 7.4% Can Stock Price Continue to Rise in 2026?
TradingKey - At the start of 2026, global entertainment giant Disney (DIS) faced a disappointing start to the year. Its Q1 FY2026 earnings report showed that revenue grew 5% year-on-year to $25.98 billion, seemingly achieving steady growth; however, net profit fell 6% year-on-year to $2.4 billion. N