

US Dollar Index Price Forecast: Finds floor at long-term historical support level

- The US Dollar Index has touched down on a key support level at the 100 mark.
- This has historically provided a springboard for a recovery, however, it is too early to say whether history will repeat itself.
The US Dollar Index (DXY) is in a medium and long-term sideways trend within a multi-year range. Since late July it has been steadily unfolding a down leg within that range from the ceiling at around 105, to the range floor at the 100 level.
100 is important. Apart from being a key psychological level, 100 is also a major historical support level which has provided a safety net to falling prices on three prior occasions since 2023 (circled below). The question is, will 100 come to the rescue again on this occasion?
US Dollar Index Daily Chart
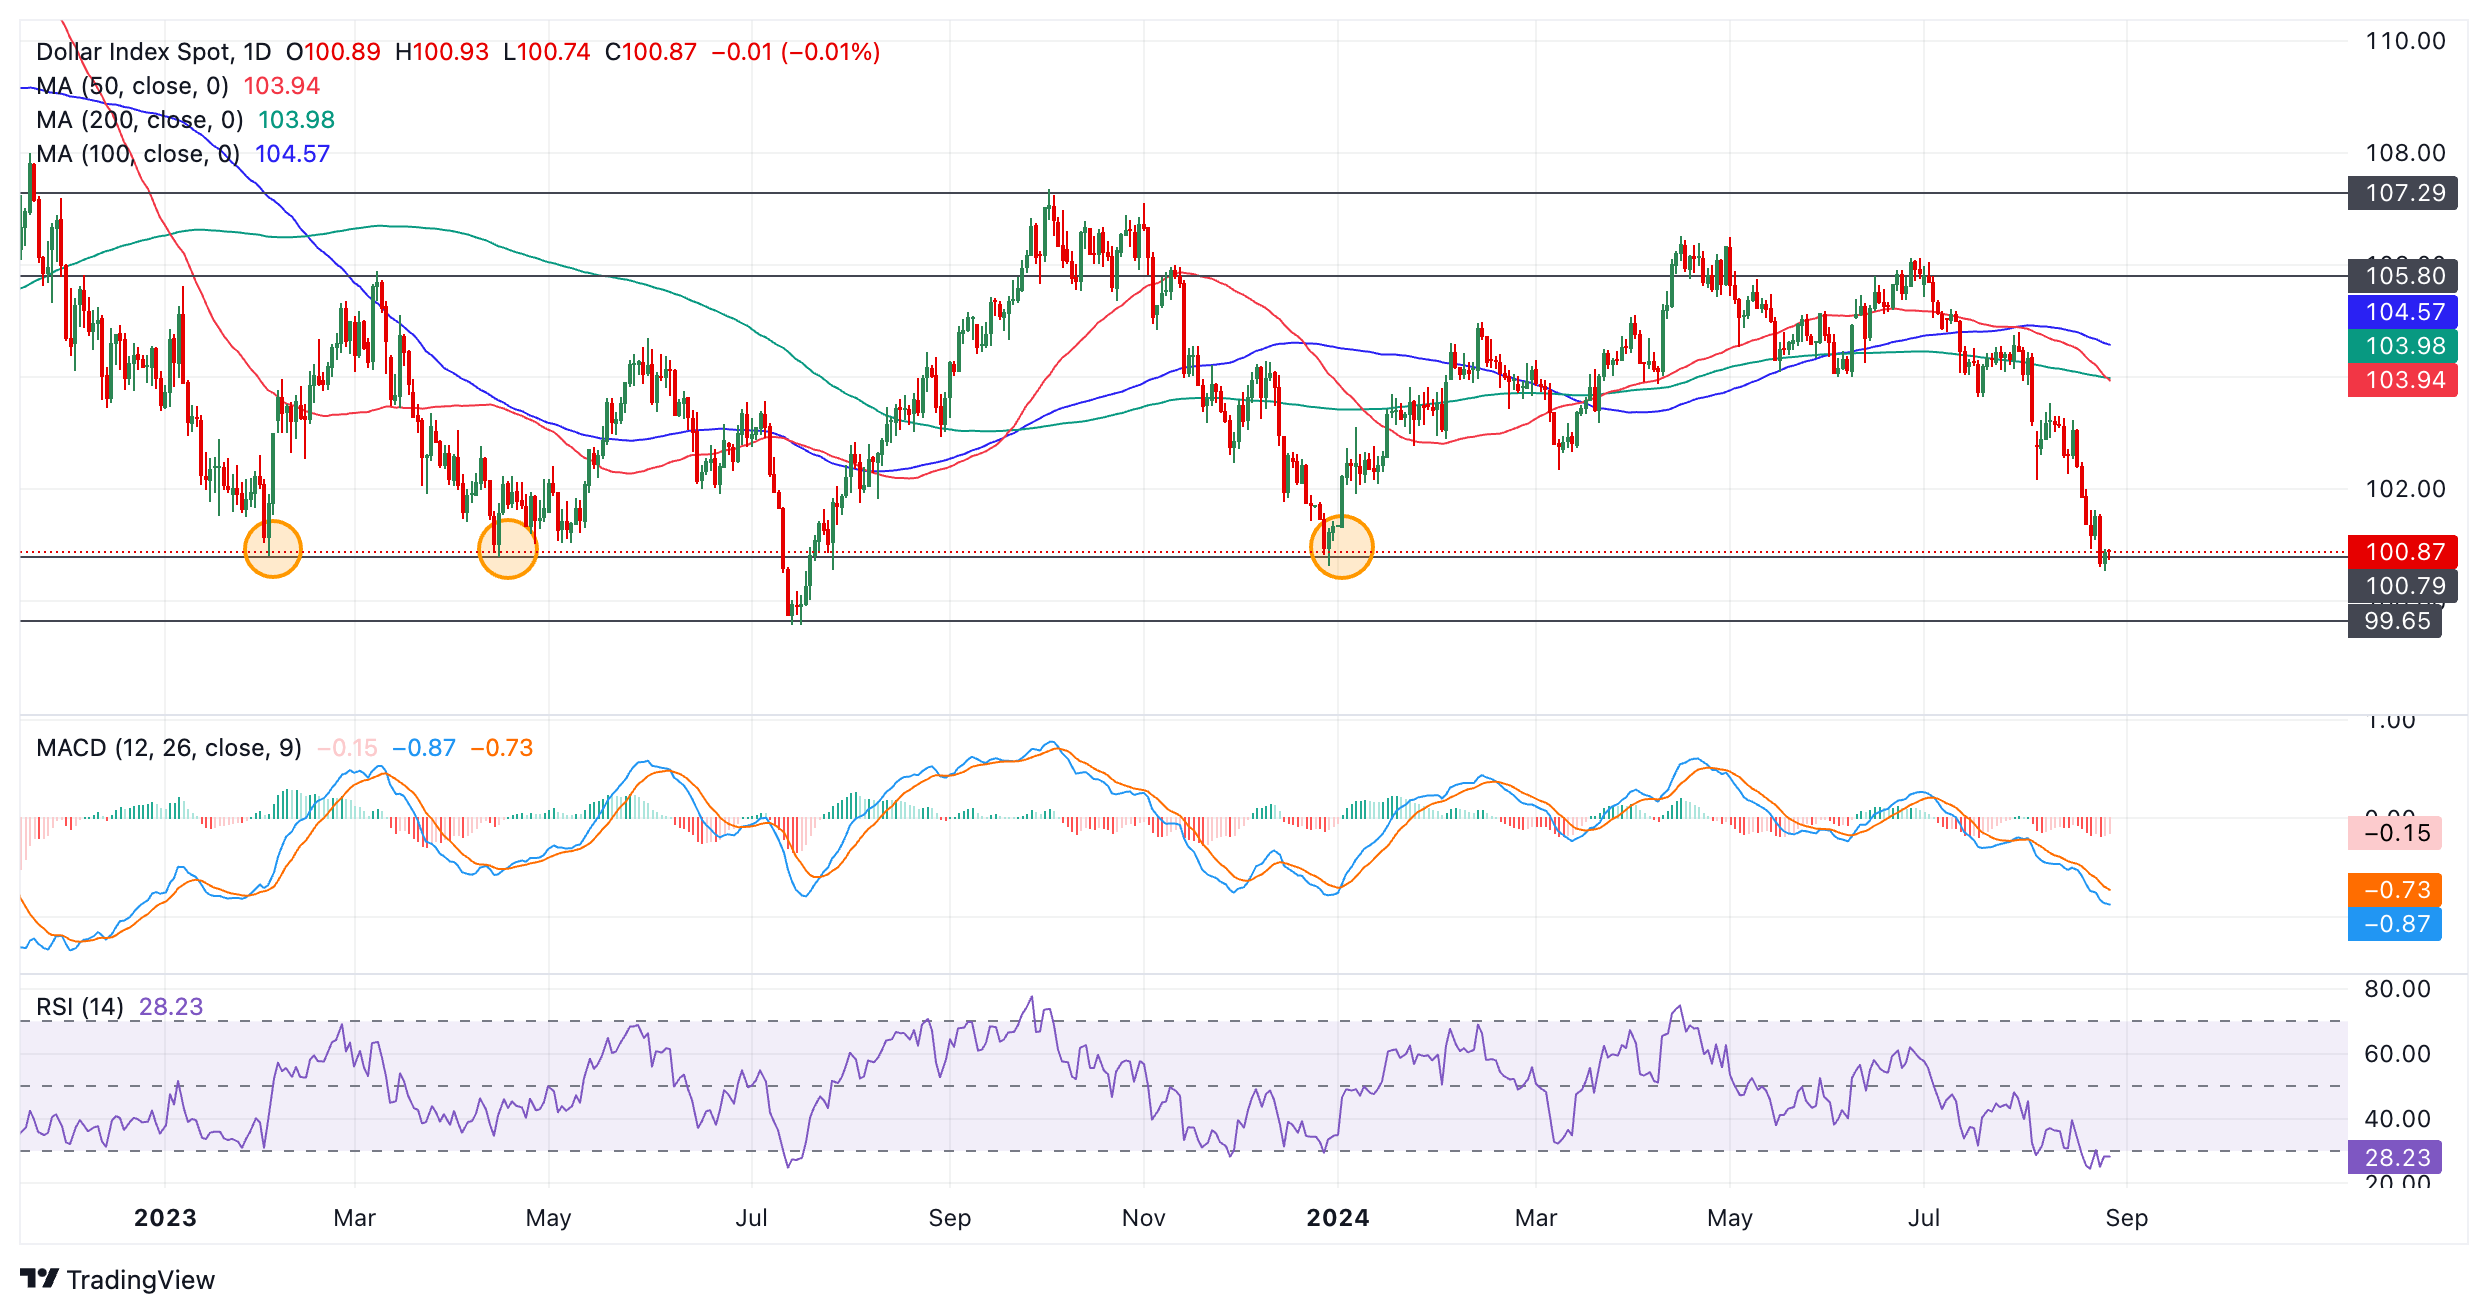
Price action is still bearish and there are no strong bullish reversal patterns forming – neither of the shape or the candlestick variety. This suggests a risk of more downside. A continuation south would probably see DXY reach the next support level at the 99.57, the July 2023 low. This is the lowest floor of the range – a decisive break below there would be a very bearish sign.
The Relative Strength Index (RSI) momentum indicator is oversold on both the daily chart and weekly chart (not shown). This suggests prices are overextended to the downside and there is a greater risk of a pull back occurring.
However, RSI has not yet exited the oversold zone, a necessary prerequisite for a buy signal. As things stand, the fact the RSI is oversold is merely a warning for bears not to add to their short positions, it would have to fully rise out of oversold to provide a reversal signal.
The Moving Average Convergence Divergence (MACD) momentum oscillator has not crossed above its red signal line yet either. This too would be required to provide a buy signal.
To conclude, there is a risk that although the US Dollar Index has reached a historic low it could simply continue falling unless price action forms a reversal pattern or momentum indicators provide firm buy signals.
Related Articles
$660B Capex Bill Triggers $900B Wipeout: Why Apple Shares Outperform Amazon and Google Despite AI Lag
Based on financial disclosures, the combined 2026 capital expenditure forecasts for Meta, Amazon, Google, and Microsoft are projected to reach $660 billion. This figure is not only significantly higher than the $410 billion forecast for 2025 and $245 billion for 2024, but even surpasses the GDP of I
Amazon Stock Predictions for 2026 to 2030: Will They Exceed Expectations and Achieve Major Long-Term Goals?
TradingKey - As we head into 2026, many investors are questioning where Amazon (AMZN) fits into the technology world.
A Crash After a Surge: Why Silver Lost 40% in a Week?
TradingKey - Spot silver (XAGUSD) prices continue to decline. Silver plunged 20% on Thursday, breaking below $71 per ounce, with the sell-off intensifying on Friday as prices fell further below $64. Compared to the all-time high set on January 29, silver prices have retraced more than 40%, wiping out nearly all gains accumulated over the previous month.
Is Bitcoin’s Four-Year Cycle Dead in 2026?
Is the Bitcoin 4-year cycle dead? After 2025 broke historical records with a red post-halving year, institutional analysts explore if the Bitcoin price has decoupled from the halving countdown. Analyze the impact of spot ETFs, global liquidity, and the roadmap to the 2028 halving in this 2026 market

