Dow Jones Industrial Average roils after mixed US data on Wednesday
- Dow Jones cycles 38,700.00 after US labor preview eases.
- US ISM Services PMI accelerated to multi-month highs.
- Mixed data hinted enough softness to bolster rate cut hopes further.
The Dow Jones Industrial Average (DJIA) is treading water on Wednesday, grappling with 38,750.00. After US data printed mixed, rate cut expectations held on the high side but gains in the Dow Jones index remain limited.
US ADP Employment Change in May eased to 152K compared to the forecast 173K, and the previous month’s print also saw a downside revision to 188K from 192K. US ISM Services Purchasing Managers Index (PMI) jumped to a nine-month high of 53.8, well above the forecast 50.8 and vaulting over the previous 16-month low of 49.4.
Despite a healthy uptick in services activities, markets are focusing on the cooling effect of easing ADP labor figures. According to the CME’s FedWatch Tool, rate markets are pricing in 80% odds of a rate cut of at least 25 basis points at the Federal Reserve’s (Fed) September rate meeting.
Broader markets will be pivoting to look ahead to Friday’s upcoming US Nonfarm Payrolls (NFP) print, which is forecast to increase to 185K from the previous month’s 175K. With rate cut hopes pinning into the high side once more, investors will be looking for a softer NFP print and downside revisions to previous figures.
Dow Jones news
The Dow Jones is holding steady on Wednesday, with roughly half of the index’s stocks in the green during the midweek market session. Intel Corp (INTC) rose around 2.0%, climbing over $30.00 per share. On the low end, Cisco Systems Inc. (CSCO) tumbled -3.26% to $45.88 per share on Wednesday, falling to a new 52-week low as investors remain skeptical about the profitability of Cisco System’s newly-unveiled AI-driven ThousandEyes internet monitoring unit. Cisco’s ThousandEyes is billed as an internet-mapping and automated security tool.
Dow Jones technical outlook
Dow Jones is trading tightly near 38,700.00 on Wednesday as the major equity index struggles to share gains found by similar US indexes. The DJIA is struggling under the weight of near-term losses after tumbling from record highs above 40,000.00.
Daily candlesticks are knocking on a supply zone below 38,000.00, and long-term technical support is priced in at the 200-day Exponential Moving Average (EMA) at 37,297.33. The Dow Jones has arrest a near-term decline, but still remains down -3.35% from record high bids set in mid-May.
Dow Jones five minute chart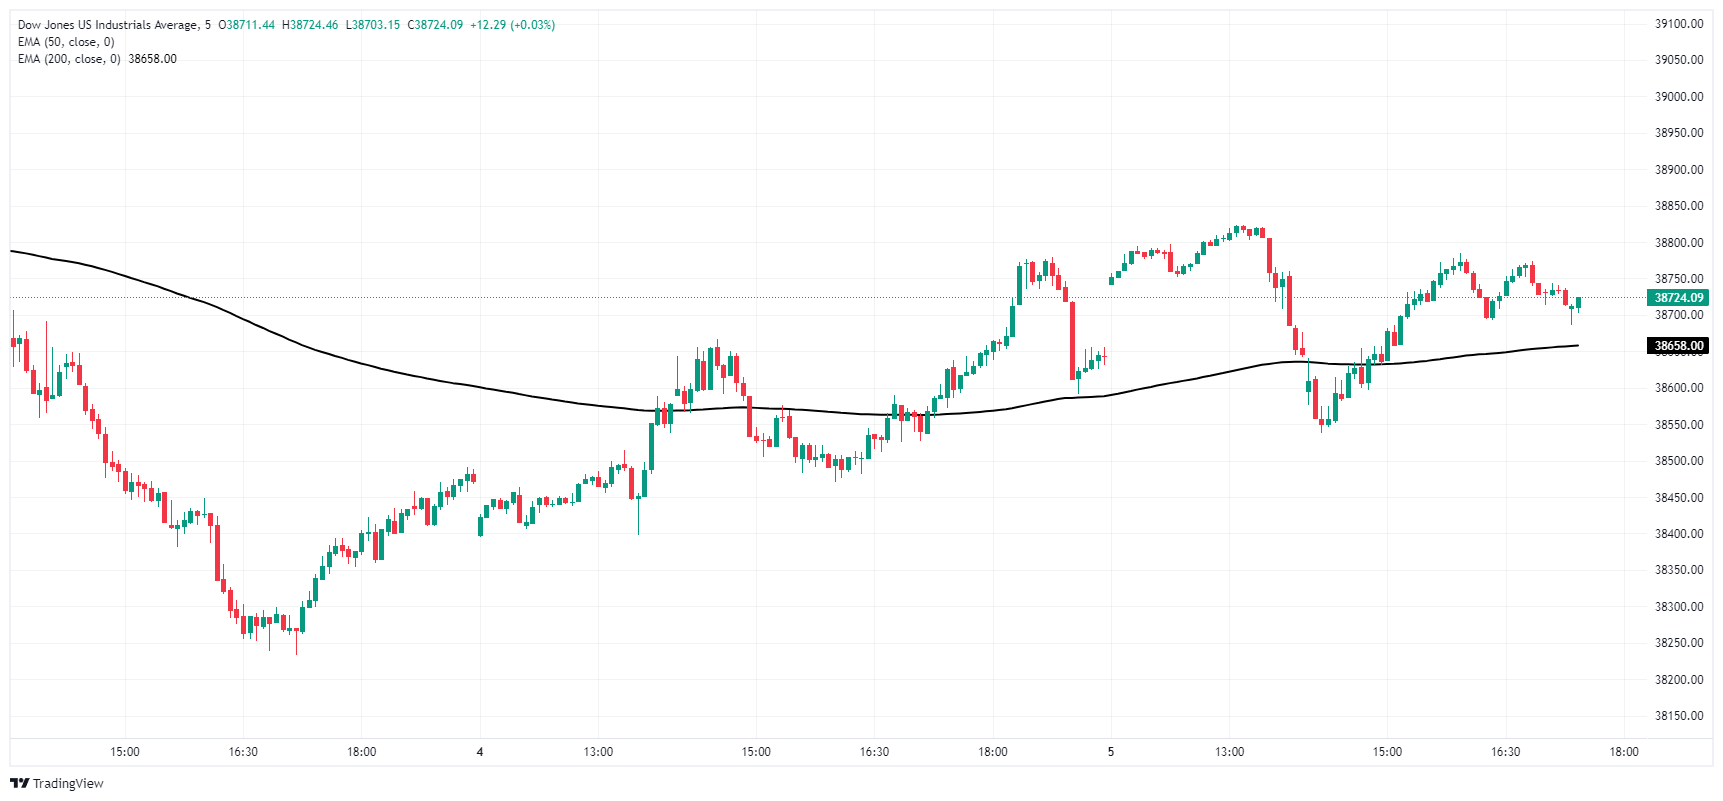
Dow Jones daily chart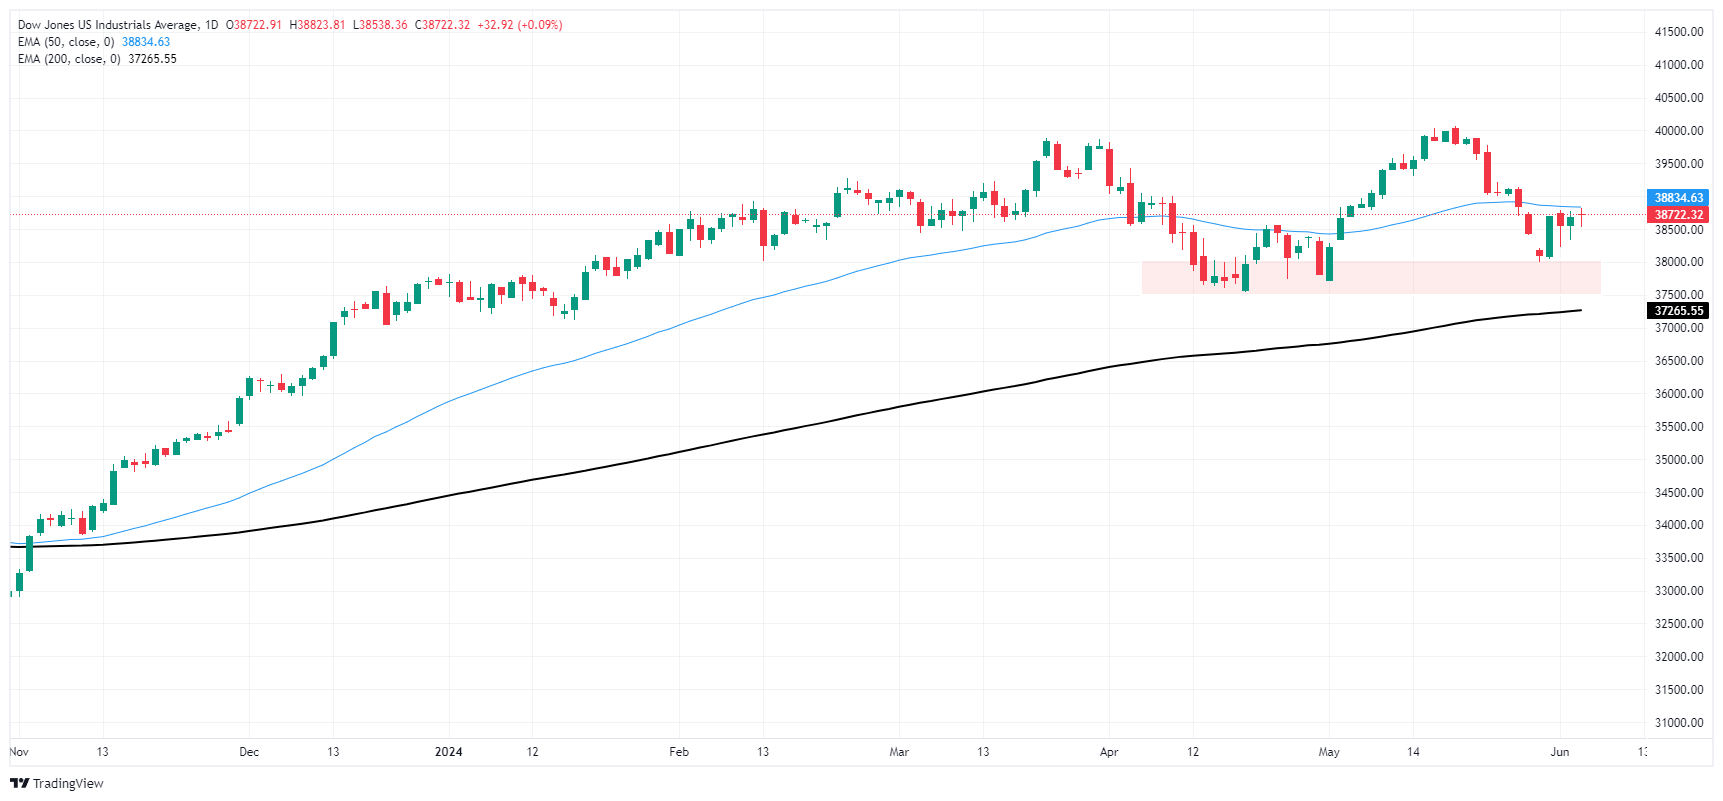
Dow Jones FAQs
The Dow Jones Industrial Average, one of the oldest stock market indices in the world, is compiled of the 30 most traded stocks in the US. The index is price-weighted rather than weighted by capitalization. It is calculated by summing the prices of the constituent stocks and dividing them by a factor, currently 0.152. The index was founded by Charles Dow, who also founded the Wall Street Journal. In later years it has been criticized for not being broadly representative enough because it only tracks 30 conglomerates, unlike broader indices such as the S&P 500.
Many different factors drive the Dow Jones Industrial Average (DJIA). The aggregate performance of the component companies revealed in quarterly company earnings reports is the main one. US and global macroeconomic data also contributes as it impacts on investor sentiment. The level of interest rates, set by the Federal Reserve (Fed), also influences the DJIA as it affects the cost of credit, on which many corporations are heavily reliant. Therefore, inflation can be a major driver as well as other metrics which impact the Fed decisions.
Dow Theory is a method for identifying the primary trend of the stock market developed by Charles Dow. A key step is to compare the direction of the Dow Jones Industrial Average (DJIA) and the Dow Jones Transportation Average (DJTA) and only follow trends where both are moving in the same direction. Volume is a confirmatory criteria. The theory uses elements of peak and trough analysis. Dow’s theory posits three trend phases: accumulation, when smart money starts buying or selling; public participation, when the wider public joins in; and distribution, when the smart money exits.
There are a number of ways to trade the DJIA. One is to use ETFs which allow investors to trade the DJIA as a single security, rather than having to buy shares in all 30 constituent companies. A leading example is the SPDR Dow Jones Industrial Average ETF (DIA). DJIA futures contracts enable traders to speculate on the future value of the index and Options provide the right, but not the obligation, to buy or sell the index at a predetermined price in the future. Mutual funds enable investors to buy a share of a diversified portfolio of DJIA stocks thus providing exposure to the overall index.
Related Articles
The Future of AI Runs on NVIDIA
NVIDIA’s Q4 FY25 revenue surged 78% YoY to $39.3 billion, with data center sales up 93% to $35.6 billion, driven by hyperscaler AI adoption.
A Shift from Hardware to Software in the AI Industry Cycle - These AI Software Stocks Deserve Attention!
TradingKey – The rapid development of artificial intelligence (AI) technology has shifted the spotlight from proprietary models like ChatGPT to open-source alternatives like DeepSeek in just a few years. Capital markets are now pricing in a new AI cycle: the transition from the AI hardware era to...
Bank of Japan Interest Rate Decision Preview: Pause on Rate Hikes Already Priced In, Minimal Market Movement Expected on the Day
On 19 March 2025, the Bank of Japan (BoJ) will announce its March interest rate decision. The market widely expects the central bank to maintain its policy rate unchanged at 0.5%. We align with this consensus forecast.
[IN-DEPTH ANALYSIS] Coinbase: The Next Chapter of Crypto from Trading to Consumer Apps
Our valuation estimates its intrinsic worth at $75–$87 billion, suggesting meaningful upside potential from its current market cap of $50 billion. While risks such as regulatory uncertainty and crypto market volatility remain, Coinbase’s diversified revenue streams and strong execution capabilities
[IN-DEPTH ANALYSIS] Walmart (WMT): When a Strong Business Model Faces Economic Challenges
With growth further moderating and too many headwinds hitting the margins we would likely see stagnant to negative growth in earnings, which makes the current share price of $85.00 less attractive.