tradingkey.logo

AUD/JPY Price Analysis: Extends gains toward 95.30 amid overbought momentum

FXStreetMar 27, 2025 10:03 PM
  • AUD/JPY was seen around the 95.20 zone on Thursday, building on bullish momentum ahead of the Asian session.
  • Key support is seen near 95.20 and 94.90, while resistance stands at 95.34 and 96.43.

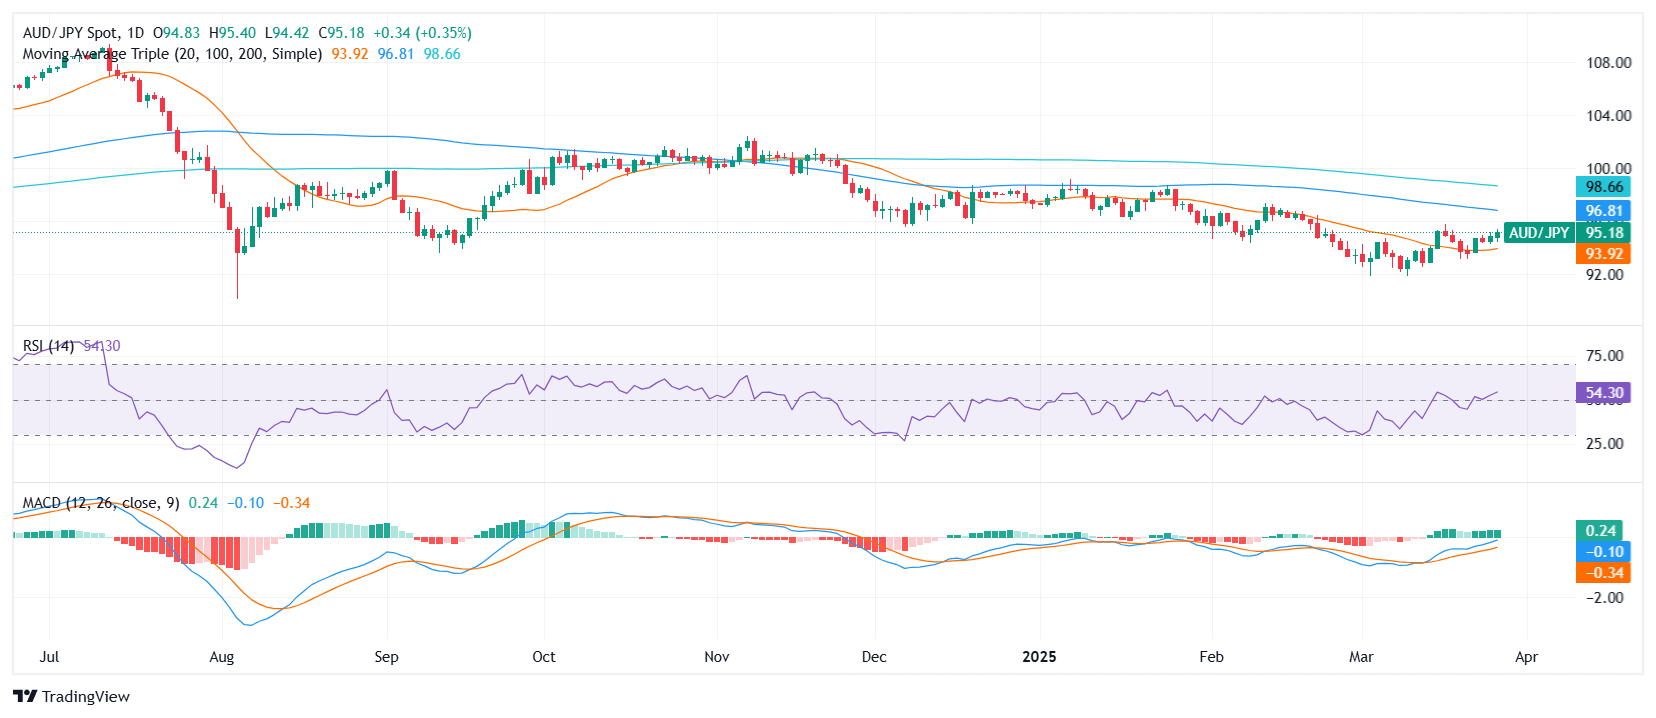
The AUD/JPY pair extended its winning streak on Thursday, advancing toward the 95.30 region after a strong daily performance. The pair is trading with a bullish tone after gaining traction during the European session, now sitting comfortably near the midpoint of its daily range between 94.42 and 95.40. This movement comes during Thursday’s session ahead of the Asian open, where momentum remains in the bulls’ favor despite signs of exhaustion.

From a technical standpoint, the short-term picture favors buyers. The 10-day Exponential Moving Average (EMA) at 94.50, 10-day Simple Moving Average (SMA) at 94.56, and 20-day SMA at 93.98 all point to continued upside pressure. Meanwhile, the Moving Average Convergence Divergence (MACD) signals a fresh buy, reinforcing the bullish structure.The Awesome Oscillator and Ultimate Oscillator (56.2) also remain neutral, hinting at the possibility of a pause or minor correction in the short term.

On the downside, immediate support aligns at 95.23, followed by 94.90 and 94.65. To the upside, resistance emerges at 95.34, with further barriers at 96.43 and 96.92. Although longer-term SMAslike the 100-day at 96.92 and 200-day at 98.75 suggest lingering bearish pressure, the current short-term outlook remains tilted in favor of continued gains, barring a reversal triggered by overbought conditions.

AUD/JPY daily chart
Disclaimer: The information provided on this website is for educational and informational purposes only and should not be considered financial or investment advice.
tradingkey.logo
tradingkey.logo
Intraday Data provided by Refinitiv and subject to terms of use. Historical and current end-of-day data provided by Refinitiv. All quotes are in local exchange time. Real-time last sale data for U.S. stock quotes reflect trades reported through Nasdaq only. Intraday data delayed at least 15 minutes or per exchange requirements.
* References, analysis, and trading strategies are provided by the third-party provider, Trading Central, and the point of view is based on the independent assessment and judgement of the analyst, without considering the investment objectives and financial situation of the investors.
Risk Warning: Our Website and Mobile App provides only general information on certain investment products. Finsights does not provide, and the provision of such information must not be construed as Finsights providing, financial advice or recommendation for any investment product.
Investment products are subject to significant investment risks, including the possible loss of the principal amount invested and may not be suitable for everyone. Past performance of investment products is not indicative of their future performance.
Finsights may allow third party advertisers or affiliates to place or deliver advertisements on our Website or Mobile App or any part thereof and may be compensated by them based on your interaction with the advertisements.
© Copyright: FINSIGHTS MEDIA PTE. LTD. All Rights Reserved.