

EUR/USD Price Analysis: Euro extends losses but 100-200 SMA crossover offers support

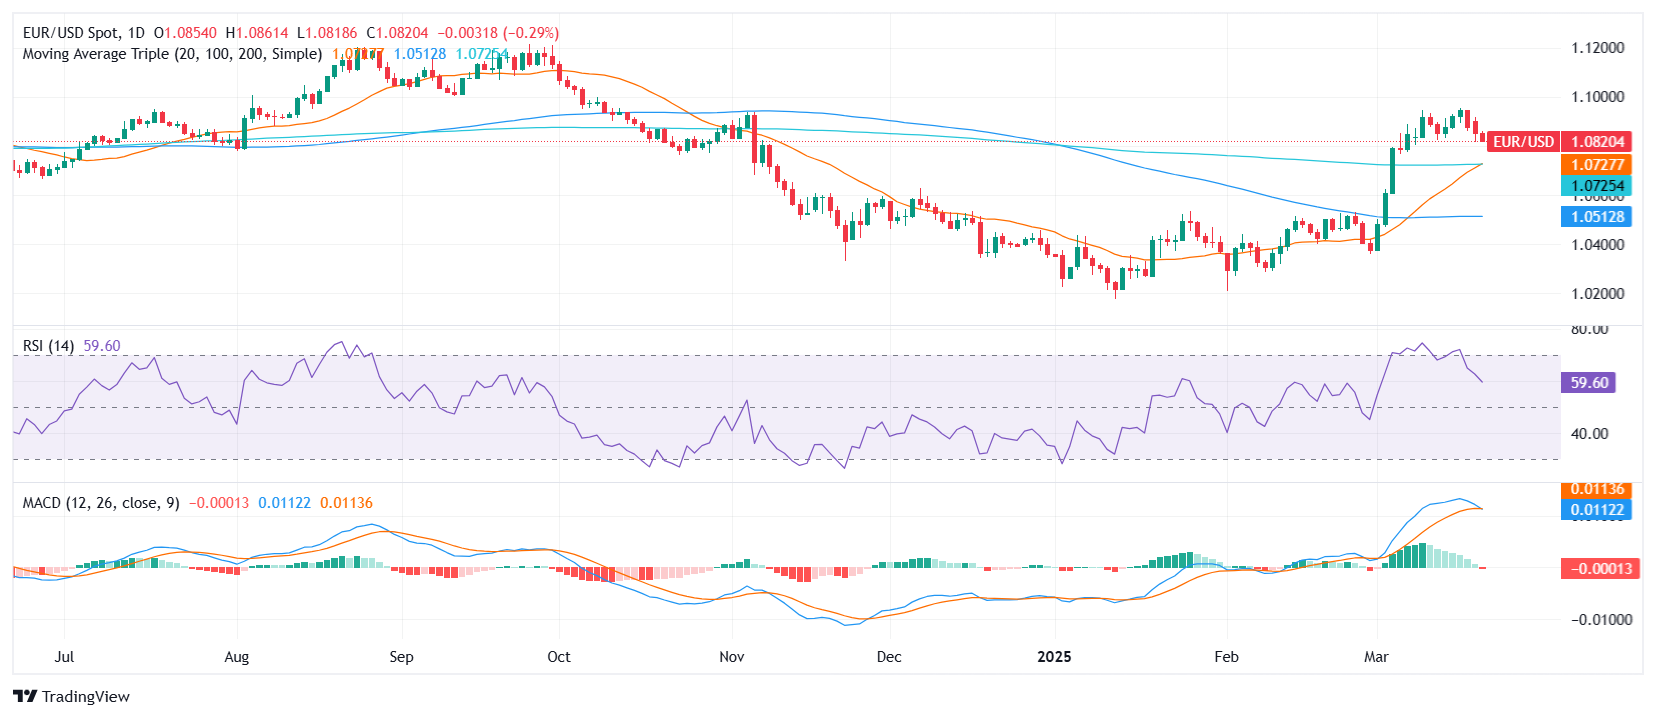
- EUR/USD was seen trading around the 1.0820 area after the European session, falling for a third consecutive day.
- Despite shedding over 1% this week, the recent bullish crossover between the 100- and 200-day SMAs may provide a strong base.
- Momentum indicators turn bearish, with RSI dropping sharply and MACD printing a fresh red bar.
EUR/USD declined on Friday’s session after the European close, moving near the 1.0820 zone as the pair tallied a third straight day in the red. After a strong rally earlier in the month, the pair has lost over 1% this week, with momentum indicators now flashing bearish signals. Still, structural support remains firm as key moving averages align beneath current price levels.
The Relative Strength Index (RSI) has sharply retreated within positive territory and now hovers near neutral, hinting at fading bullish momentum. Meanwhile, the Moving Average Convergence Divergence (MACD) has shifted direction, printing a fresh red bar, which confirms weakening momentum in the short term.
From a broader perspective, a bullish crossover between the 100-day and 200-day Simple Moving Averages has taken shape this week, forming a solid technical floor near the 1.0730 region. This development helps cushion the downside, even if sellers continue to weigh on the pair in the near term.
Looking ahead, immediate support is seen at the 1.0780-1.0730 zone, where the moving average crossover occurred. A break below could expose further losses toward 1.0660. On the upside, resistance now sits at 1.0900, followed by 1.1000 should buyers regain control.
EUR/USD daily chart
Related Articles
$660B Capex Bill Triggers $900B Wipeout: Why Apple Shares Outperform Amazon and Google Despite AI Lag
Based on financial disclosures, the combined 2026 capital expenditure forecasts for Meta, Amazon, Google, and Microsoft are projected to reach $660 billion. This figure is not only significantly higher than the $410 billion forecast for 2025 and $245 billion for 2024, but even surpasses the GDP of I
Amazon Stock Predictions for 2026 to 2030: Will They Exceed Expectations and Achieve Major Long-Term Goals?
TradingKey - As we head into 2026, many investors are questioning where Amazon (AMZN) fits into the technology world.
A Crash After a Surge: Why Silver Lost 40% in a Week?
TradingKey - Spot silver (XAGUSD) prices continue to decline. Silver plunged 20% on Thursday, breaking below $71 per ounce, with the sell-off intensifying on Friday as prices fell further below $64. Compared to the all-time high set on January 29, silver prices have retraced more than 40%, wiping out nearly all gains accumulated over the previous month.
Is Bitcoin’s Four-Year Cycle Dead in 2026?
Is the Bitcoin 4-year cycle dead? After 2025 broke historical records with a red post-halving year, institutional analysts explore if the Bitcoin price has decoupled from the halving countdown. Analyze the impact of spot ETFs, global liquidity, and the roadmap to the 2028 halving in this 2026 market

