

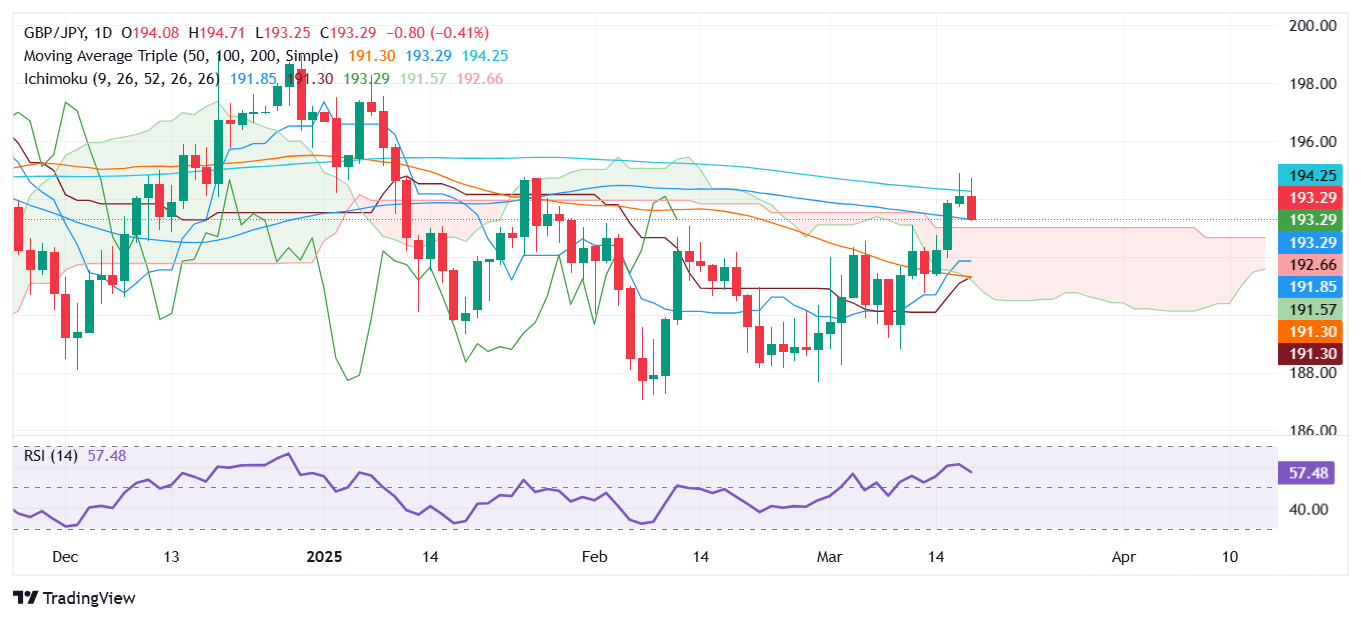
GBP/JPY Price Forecast: Retreats below 193.50 after struggling near 195.00

- GBP/JPY falls to 193.28, ending three-day rally after failing to surpass 195.00 and 200-day SMA at 194.18.
- Trading sideways; support at 193.23 (100-day SMA) and 192.28 (Senkou Span B) maintains range-bound status.
- Break below 192.28 could target 191.83 (Tenkan-sen); push above 194.89 may challenge 195.00 resistance.
The GBP/JPY retreats after rallying for three straight trading days since last Friday. However, it struggled to clear the 195.00 figure and the 200-day Simple Moving Average (SMA), which exacerbated a drop in the cross pair beneath the 193.50 area. At the time of writing, the pair hovers near 193.28, virtually unchanged.
GBP/JPY Price Forecast: Technical outlook
The GBP/JPY trades sideways for the second straight day, capped on the downside by the 100-day Simple Moving Average (SMA) at 193.23 and the Senkou Span B near 192.28. On the top side, the 200-day SMA at 194.18 would likely keep the pair trading range bound.
Additionally, despite being bullish, the Relative Strength Index (RSI) is flat. Hence, buyers and sellers lack the strength to break the trading range.
If GBP/JPY falls below 192.28, the next support would be the Tenkan-sen at 191.83, followed by the Kijun-sen at 191.24. Conversely, if GBP/JPY climbs past the 200-day SMA, the next resistance would be the March 18 peak at 194.89, ahead of 195.00.
GBP/JPY Price Chart – Daily
British Pound PRICE This week
The table below shows the percentage change of British Pound (GBP) against listed major currencies this week. British Pound was the strongest against the US Dollar.
| USD | EUR | GBP | JPY | CAD | AUD | NZD | CHF | |
|---|---|---|---|---|---|---|---|---|
| USD | -0.28% | -0.54% | -0.10% | -0.44% | -0.46% | -1.27% | -0.94% | |
| EUR | 0.28% | -0.38% | -0.21% | -0.15% | -0.31% | -1.00% | -0.68% | |
| GBP | 0.54% | 0.38% | 0.48% | 0.02% | 0.05% | -0.63% | -0.37% | |
| JPY | 0.10% | 0.21% | -0.48% | -0.34% | -0.56% | -1.12% | -0.96% | |
| CAD | 0.44% | 0.15% | -0.02% | 0.34% | -0.20% | -0.82% | -1.05% | |
| AUD | 0.46% | 0.31% | -0.05% | 0.56% | 0.20% | -0.67% | -0.35% | |
| NZD | 1.27% | 1.00% | 0.63% | 1.12% | 0.82% | 0.67% | 0.32% | |
| CHF | 0.94% | 0.68% | 0.37% | 0.96% | 1.05% | 0.35% | -0.32% |
The heat map shows percentage changes of major currencies against each other. The base currency is picked from the left column, while the quote currency is picked from the top row. For example, if you pick the British Pound from the left column and move along the horizontal line to the US Dollar, the percentage change displayed in the box will represent GBP (base)/USD (quote).
Related Articles
Amazon Stock Predictions for 2026 to 2030: Will They Exceed Expectations and Achieve Major Long-Term Goals?
TradingKey - As we head into 2026, many investors are questioning where Amazon (AMZN) fits into the technology world.
A Crash After a Surge: Why Silver Lost 40% in a Week?
TradingKey - Spot silver (XAGUSD) prices continue to decline. Silver plunged 20% on Thursday, breaking below $71 per ounce, with the sell-off intensifying on Friday as prices fell further below $64. Compared to the all-time high set on January 29, silver prices have retraced more than 40%, wiping out nearly all gains accumulated over the previous month.
Is Bitcoin’s Four-Year Cycle Dead in 2026?
Is the Bitcoin 4-year cycle dead? After 2025 broke historical records with a red post-halving year, institutional analysts explore if the Bitcoin price has decoupled from the halving countdown. Analyze the impact of spot ETFs, global liquidity, and the roadmap to the 2028 halving in this 2026 market
USD Dollar Trend Forecast: Dollar Index Falls Below 97.0 to 4-Year Low, Will the Dollar Continue To Fall or Bottom Out in 2026?
TradingKey - In January 2026, the US Dollar Index continued its downward trend from 2025, officially breaking below the key 97.0 level and reaching a low of 95.5, marking a nearly four-year low since February 2022.

