

EUR/JPY Price Forecast: Falls to near 162.50; next support appears at nine-day EMA

- EUR/JPY may face key resistance at the upper boundary of the ascending channel near 164.50.
- The 14-day Relative Strength Index stays above 50, strengthening the bullish outlook.
- Initial support is seen at the nine-day EMA around 161.57.
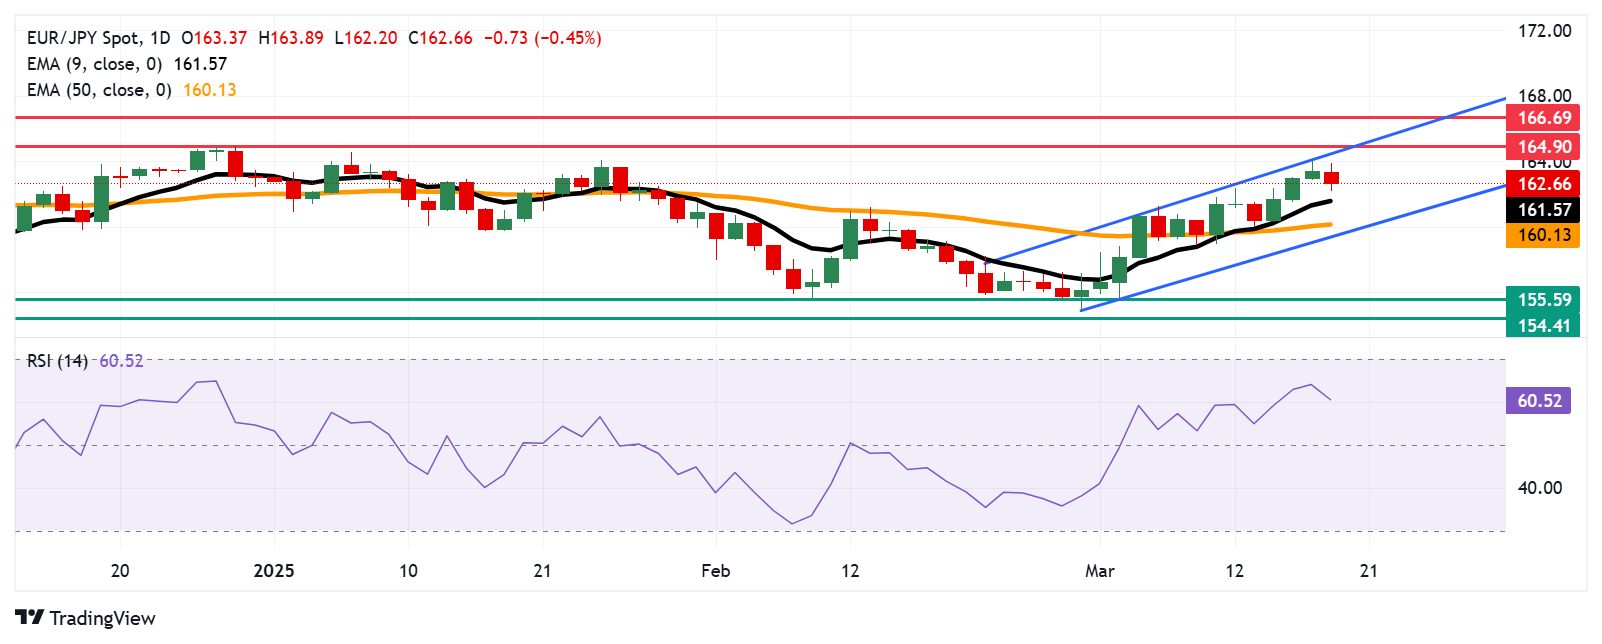
EUR/JPY pauses its three-day winning streak, hovering around 162.60 during early European trading on Wednesday. Technical analysis of the daily chart suggested that the currency cross is trending higher within an ascending channel, indicating a continued bullish bias.
Additionally, the 14-day Relative Strength Index (RSI) remains above 50, reinforcing the bullish outlook for the EUR/JPY cross. Furthermore, the currency cross's position above the nine- and 50-day Exponential Moving Averages (EMAs) underscores strong short- and medium-term price momentum, supporting the potential for further gains.
On the upside, the EUR/JPY cross may encounter its first key resistance at the upper boundary of the ascending channel near 164.50, followed by the four-month high of 164.90, recorded on December 30. A decisive break above this critical zone could strengthen the bullish bias, paving the way for a potential test of the eight-month high at 166.69.
The EUR/JPY cross may find initial support at the nine-day EMA of 161.57. A break below this level could weaken short-term price momentum, leading the currency cross toward the 50-day EMA at 160.13, followed by the lower boundary of the ascending channel at 159.30.
A further decline below this critical support zone could erode medium-term momentum, increasing downward pressure on the currency cross. This could push the EUR/JPY cross toward its monthly low of 155.59, recorded on March 4, and potentially to 154.41, the lowest level last seen in December 2023.
EUR/JPY: Daily Chart
Euro PRICE Today
The table below shows the percentage change of Euro (EUR) against listed major currencies today. Euro was the weakest against the US Dollar.
| USD | EUR | GBP | JPY | CAD | AUD | NZD | CHF | |
|---|---|---|---|---|---|---|---|---|
| USD | 0.50% | 0.25% | -0.01% | 0.19% | 0.48% | 0.54% | 0.06% | |
| EUR | -0.50% | -0.25% | -0.49% | -0.31% | 0.00% | 0.04% | -0.43% | |
| GBP | -0.25% | 0.25% | -0.25% | -0.06% | 0.25% | 0.29% | -0.20% | |
| JPY | 0.01% | 0.49% | 0.25% | 0.17% | 0.50% | 0.51% | 0.06% | |
| CAD | -0.19% | 0.31% | 0.06% | -0.17% | 0.32% | 0.37% | -0.14% | |
| AUD | -0.48% | -0.00% | -0.25% | -0.50% | -0.32% | 0.04% | -0.40% | |
| NZD | -0.54% | -0.04% | -0.29% | -0.51% | -0.37% | -0.04% | -0.48% | |
| CHF | -0.06% | 0.43% | 0.20% | -0.06% | 0.14% | 0.40% | 0.48% |
The heat map shows percentage changes of major currencies against each other. The base currency is picked from the left column, while the quote currency is picked from the top row. For example, if you pick the Euro from the left column and move along the horizontal line to the US Dollar, the percentage change displayed in the box will represent EUR (base)/USD (quote).
Related Articles
Amazon Stock Predictions for 2026 to 2030: Will They Exceed Expectations and Achieve Major Long-Term Goals?
TradingKey - As we head into 2026, many investors are questioning where Amazon (AMZN) fits into the technology world.
A Crash After a Surge: Why Silver Lost 40% in a Week?
TradingKey - Spot silver (XAGUSD) prices continue to decline. Silver plunged 20% on Thursday, breaking below $71 per ounce, with the sell-off intensifying on Friday as prices fell further below $64. Compared to the all-time high set on January 29, silver prices have retraced more than 40%, wiping out nearly all gains accumulated over the previous month.
Is Bitcoin’s Four-Year Cycle Dead in 2026?
Is the Bitcoin 4-year cycle dead? After 2025 broke historical records with a red post-halving year, institutional analysts explore if the Bitcoin price has decoupled from the halving countdown. Analyze the impact of spot ETFs, global liquidity, and the roadmap to the 2028 halving in this 2026 market
USD Dollar Trend Forecast: Dollar Index Falls Below 97.0 to 4-Year Low, Will the Dollar Continue To Fall or Bottom Out in 2026?
TradingKey - In January 2026, the US Dollar Index continued its downward trend from 2025, officially breaking below the key 97.0 level and reaching a low of 95.5, marking a nearly four-year low since February 2022.

