

GBP/JPY Price Forecast: Bearish outlook remains in play below 190.00

- GBP/JPY gathers strength to around 189.85 in Tuesday’s early European session.
- The cross keeps the negative outlook below the 100-day EMA with a bearish RSI indicator.
- The initial support emerges at 188.15; the first upside barrier is located at 190.00.
The GBP/JPY cross drifts higher to 189.85 during the early European session on Tuesday. However, the upside for the cross might be limited amid the risk-off sentiment, which is likely to boost the safe-haven currency like the Japanese Yen (JPY).
Despite the downward revision of Japan's Gross Domestic Product (GDP) for the fourth quarter (Q4), traders seem convinced that the Bank of Japan (BoJ) will raise its interest rates further amid broadening inflation in Japan. This, in turn, might underpin the JPY in the near term.
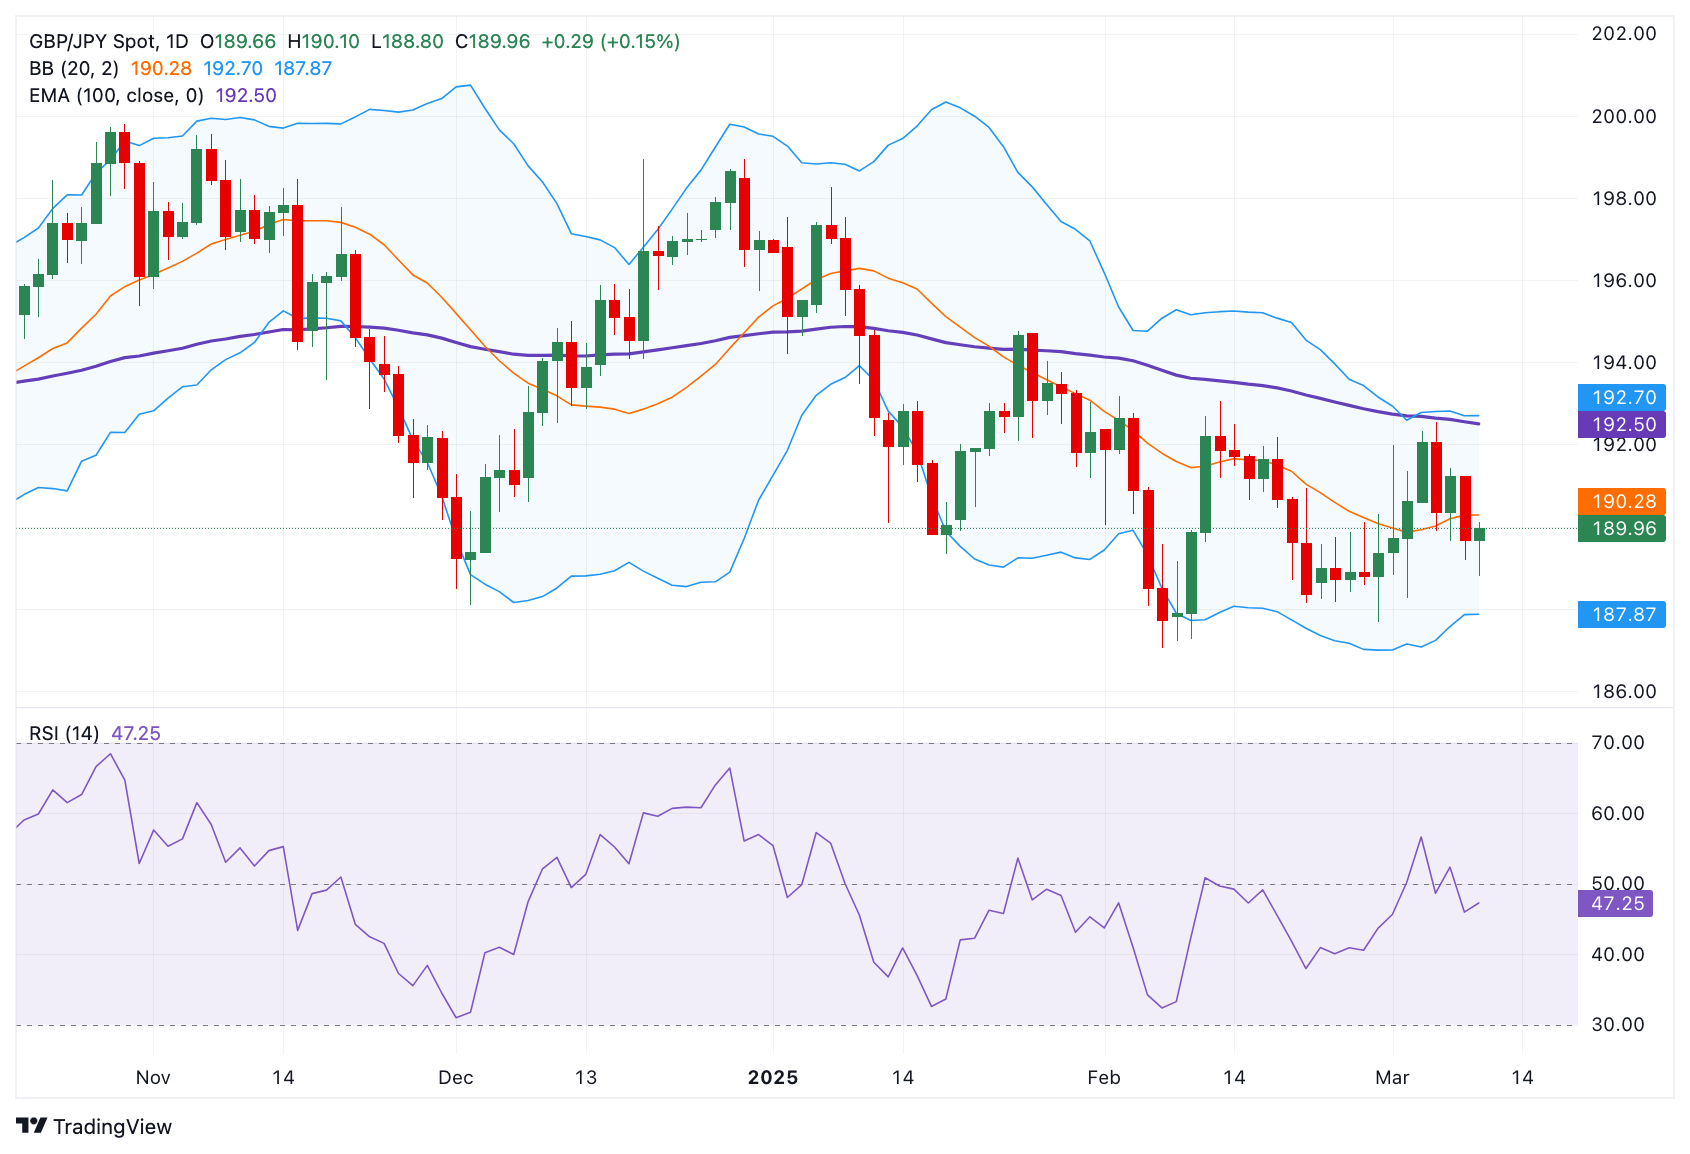
According to the daily chart, the bearish outlook of GBP/JPY remains in play as the cross remains capped below the key 100-day Exponential Moving Average (EMA). Furthermore, the downward momentum is supported by the 14-day Relative Strength Index (RSI), which is located below the midline, suggesting that the path of least resistance is to the downside.
The first downside target for the cross emerges at 188.15, the low of February 21. Extended losses could see a drop to 187.87, the lower limit of the Bollinger Band. A decisive break below the mentioned level could pave the way to 187.00, representing the psychological level and the low of February 7.
On the bright side, the first upside barrier to watch is the 190.00 psychological level. The crucial resistance level for the cross emerges at 192.50, the 100-day EMA. Sustained trading above this level could attract some buyers to 192.70, the upper boundary of the Bollinger Band. Further north, the next hurdle is seen at 194.71, the high of January 27.
GBP/JPY daily chart
Japanese Yen FAQs
The Japanese Yen (JPY) is one of the world’s most traded currencies. Its value is broadly determined by the performance of the Japanese economy, but more specifically by the Bank of Japan’s policy, the differential between Japanese and US bond yields, or risk sentiment among traders, among other factors.
One of the Bank of Japan’s mandates is currency control, so its moves are key for the Yen. The BoJ has directly intervened in currency markets sometimes, generally to lower the value of the Yen, although it refrains from doing it often due to political concerns of its main trading partners. The BoJ ultra-loose monetary policy between 2013 and 2024 caused the Yen to depreciate against its main currency peers due to an increasing policy divergence between the Bank of Japan and other main central banks. More recently, the gradually unwinding of this ultra-loose policy has given some support to the Yen.
Over the last decade, the BoJ’s stance of sticking to ultra-loose monetary policy has led to a widening policy divergence with other central banks, particularly with the US Federal Reserve. This supported a widening of the differential between the 10-year US and Japanese bonds, which favored the US Dollar against the Japanese Yen. The BoJ decision in 2024 to gradually abandon the ultra-loose policy, coupled with interest-rate cuts in other major central banks, is narrowing this differential.
The Japanese Yen is often seen as a safe-haven investment. This means that in times of market stress, investors are more likely to put their money in the Japanese currency due to its supposed reliability and stability. Turbulent times are likely to strengthen the Yen’s value against other currencies seen as more risky to invest in.
Related Articles
$660B Capex Bill Triggers $900B Wipeout: Why Apple Shares Outperform Amazon and Google Despite AI Lag
Based on financial disclosures, the combined 2026 capital expenditure forecasts for Meta, Amazon, Google, and Microsoft are projected to reach $660 billion. This figure is not only significantly higher than the $410 billion forecast for 2025 and $245 billion for 2024, but even surpasses the GDP of I
Amazon Stock Predictions for 2026 to 2030: Will They Exceed Expectations and Achieve Major Long-Term Goals?
TradingKey - As we head into 2026, many investors are questioning where Amazon (AMZN) fits into the technology world.
A Crash After a Surge: Why Silver Lost 40% in a Week?
TradingKey - Spot silver (XAGUSD) prices continue to decline. Silver plunged 20% on Thursday, breaking below $71 per ounce, with the sell-off intensifying on Friday as prices fell further below $64. Compared to the all-time high set on January 29, silver prices have retraced more than 40%, wiping out nearly all gains accumulated over the previous month.
Is Bitcoin’s Four-Year Cycle Dead in 2026?
Is the Bitcoin 4-year cycle dead? After 2025 broke historical records with a red post-halving year, institutional analysts explore if the Bitcoin price has decoupled from the halving countdown. Analyze the impact of spot ETFs, global liquidity, and the roadmap to the 2028 halving in this 2026 market

