NZD/JPY Price Analysis: Pair tests 100-day SMA amid steady momentum

FXStreetJan 7, 2025 10:00 PM
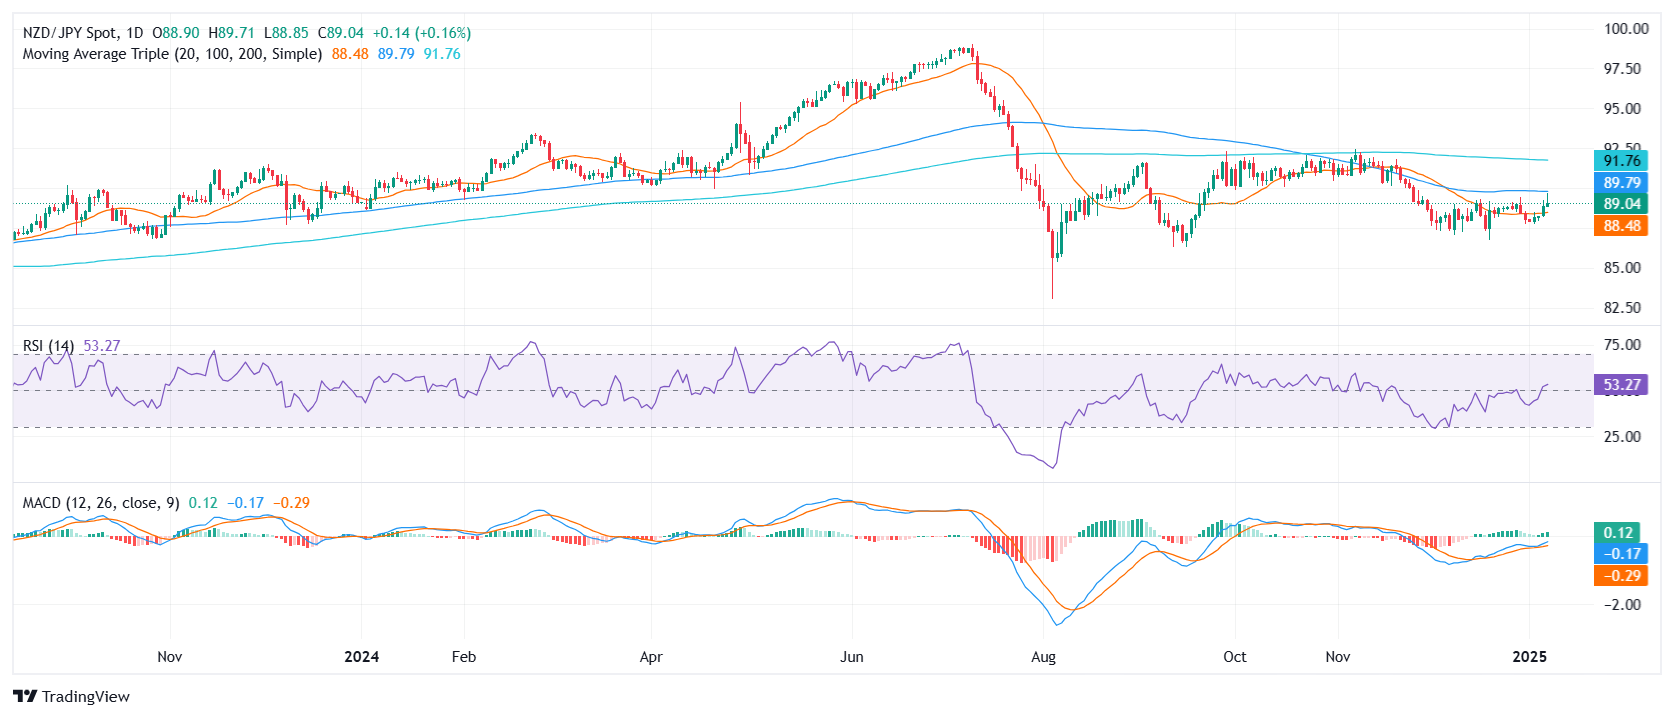
- NZD/JPY inches up to 88.90 on Tuesday, maintaining its recent positive streak.
- RSI climbs to 55, signaling improving sentiment, while MACD prints flat green bars.
- The 100-day SMA stands as a key hurdle, challenging further upside progress.
NZD/JPY extended its mild gains on Tuesday, nudging higher to 88.90 and building on the tentative recovery seen earlier in the week. Despite this constructive move, the pair appears to be stalling around the 100-day Simple Moving Average (SMA), underscoring a critical barrier that may temper the overall bullish momentum.
From a technical standpoint, the Relative Strength Index (RSI) has risen to 55, placing it in positive territory and suggesting moderate buying interest. Meanwhile, the Moving Average Convergence Divergence (MACD) histogram remains flat and green, indicating that bullish momentum is present but not overwhelming. Until NZD/JPY clears the 100-day SMA with conviction, traders may remain cautious about chasing further upside.
NZD/JPY daily chart

Disclaimer: The information provided on this website is for educational and informational purposes only and should not be considered financial or investment advice.


