

EUR/AUD Price Forecast: Climbs to two-day high above 1.6500

- EUR/AUD gains 0.67% after RBA holds rates steady, signaling a dovish outlook with easing inflation pressures.
- Despite gains, potential ECB rate cuts loom, influencing near-term trading dynamics for the cross-pair.
- Technical levels to watch: Support at 1.6450 and 1.6400, with resistance near the recent peak at 1.6540.
The EUR/AUD soared to a new two-day peak on Tuesday after the Reserve Bank of Australia (RBA) kept rates unchanged yet adopted a dovish stance, as they noted inflation is beginning to ease towards its 3% goal. At the time of writing, the cross-pair trades at 1.6497, gains over 0.67%.
EUR/AUD Price Forecast: Technical outlook
The pair began the week lower, but the RBA’s decision pushed the EUR/AUD pair toward a two-day high of 1.6540. Nevertheless, traders pared some of those gains, as the European Central Bank (ECB) is expected to lower rates at the December 12 meeting.
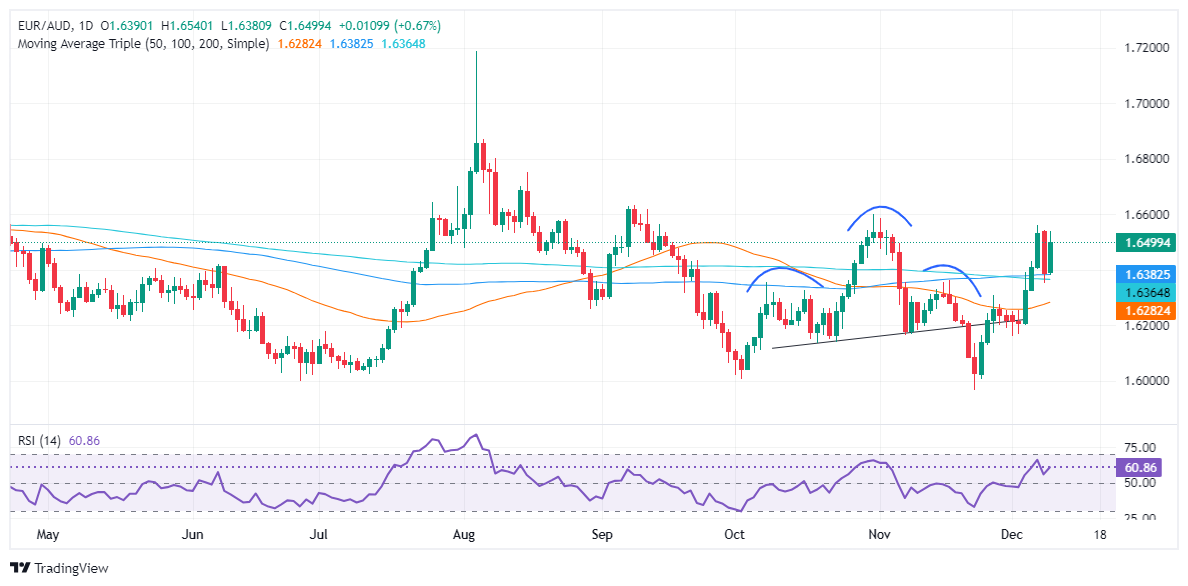
Momentum remains slightly bullish, yet the Relative Strength Index (RSI) suggests that sellers have the upper hand in the short term.
The EUR/AUD first support would be the 1.6450 area, followed by the 1.6400 psychological mark. On further weakness, the next support would be the 100-day Simple Moving Average (SMA) at 1.6382, followed by the 200-day SMA at 1.6364. A breach of the latter will expose 1.6300.
Conversely, if buyers clear 1.6500, immediate resistance would be 1.6540, followed by 1.6561, the December 6 peak.
EUR/AUD Price Chart – Daily
Euro PRICE Today
The table below shows the percentage change of Euro (EUR) against listed major currencies today. Euro was the strongest against the Japanese Yen.
| USD | EUR | GBP | JPY | CAD | AUD | NZD | CHF | |
|---|---|---|---|---|---|---|---|---|
| USD | 0.00% | -0.01% | 0.02% | 0.00% | -0.00% | -0.04% | 0.01% | |
| EUR | -0.00% | -0.02% | 0.03% | -0.00% | -0.01% | -0.05% | 0.00% | |
| GBP | 0.01% | 0.02% | 0.02% | 0.02% | 0.00% | -0.03% | 0.02% | |
| JPY | -0.02% | -0.03% | -0.02% | -0.01% | -0.02% | -0.06% | -0.01% | |
| CAD | -0.00% | 0.00% | -0.02% | 0.01% | -0.01% | -0.04% | 0.00% | |
| AUD | 0.00% | 0.01% | -0.01% | 0.02% | 0.00% | -0.04% | 0.04% | |
| NZD | 0.04% | 0.05% | 0.03% | 0.06% | 0.04% | 0.04% | 0.06% | |
| CHF | -0.01% | -0.01% | -0.02% | 0.00% | -0.01% | -0.04% | -0.06% |
The heat map shows percentage changes of major currencies against each other. The base currency is picked from the left column, while the quote currency is picked from the top row. For example, if you pick the Euro from the left column and move along the horizontal line to the US Dollar, the percentage change displayed in the box will represent EUR (base)/USD (quote).
Related Articles
$660B Capex Bill Triggers $900B Wipeout: Why Apple Shares Outperform Amazon and Google Despite AI Lag
Based on financial disclosures, the combined 2026 capital expenditure forecasts for Meta, Amazon, Google, and Microsoft are projected to reach $660 billion. This figure is not only significantly higher than the $410 billion forecast for 2025 and $245 billion for 2024, but even surpasses the GDP of I
Amazon Stock Predictions for 2026 to 2030: Will They Exceed Expectations and Achieve Major Long-Term Goals?
TradingKey - As we head into 2026, many investors are questioning where Amazon (AMZN) fits into the technology world.
A Crash After a Surge: Why Silver Lost 40% in a Week?
TradingKey - Spot silver (XAGUSD) prices continue to decline. Silver plunged 20% on Thursday, breaking below $71 per ounce, with the sell-off intensifying on Friday as prices fell further below $64. Compared to the all-time high set on January 29, silver prices have retraced more than 40%, wiping out nearly all gains accumulated over the previous month.
Is Bitcoin’s Four-Year Cycle Dead in 2026?
Is the Bitcoin 4-year cycle dead? After 2025 broke historical records with a red post-halving year, institutional analysts explore if the Bitcoin price has decoupled from the halving countdown. Analyze the impact of spot ETFs, global liquidity, and the roadmap to the 2028 halving in this 2026 market

