

Ethereum Inverse Head And Shoulders – The Pattern That Could Spark A Reversal

Beneath Ethereum’s recent price stagnation lies a potentially explosive setup taking shape. The emergence of a near-perfect inverse head and shoulders pattern suggests that ETH may be preparing to shake off its sluggishness. This stealthy accumulation pattern, now approaching its make-or-break moment, has historically preceded some of Ethereum’s most dramatic rallies.
Ethereum’s current chart structure reflects this classic pattern, where the price has formed a “left shoulder,” followed by a deeper “head” and a “right shoulder,” with the neckline acting as a critical resistance level.
Understanding Ethereum’s Inverse H&S Formation
A surge for Ethereum is becoming increasingly compelling, driven by the formation of an inverse head and shoulders (H&S) pattern. This reversal pattern suggests that Ethereum could be on the verge of a significant upward move after a period of consolidation. If the pattern completes successfully, the inverse H&S formation typically indicates an imminent bullish trend.
One key factor to watch is the neckline of the inverse H&S, which serves as a critical resistance level represented by a yellow line on the chart. For Ethereum to confirm this bullish reversal, it needs to break above the neckline. A successful breakout above this level would signal growing buying pressure, potentially triggering a surge toward higher price levels.
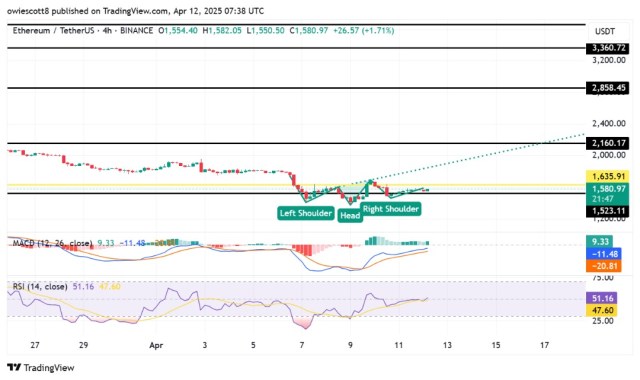
Moreover, supporting indicators like the Relative Strength Index (RSI) and Moving Average Convergence Divergence (MACD) show improving momentum, further strengthening the case for a rally. The RSI, in particular, remains in a neutral zone, giving room for more upward movement without hitting overbought territory.
With these technical signals in place, ETH might be preparing for a major surge, especially if it can hold above critical support levels and push through the neckline of the inverse head and shoulders pattern.
Ether’s Bullish Reversal: Key Levels To Watch
Beyond the neckline, Ethereum faces additional resistance at several strategic levels. The first notable level is around $2,160. A break above this zone may push Ethereum to challenge the next resistance at $2,858, where selling pressure has historically been more intense.
If the price can push through these levels, ETH would be primed for a potential run toward $3,360, a critical area marked by previous price highs. Each of these resistance levels represents psychological barriers for traders.
As ETH approaches these zones, it will be essential to observe the volume and momentum accompanying the price action. A breakout above these resistance points, confirmed by increasing volume and positive technical indicators, hints at a prolonged rally, pushing Ethereum to even higher price targets.
Related Articles
Amazon Stock Predictions for 2026 to 2030: Will They Exceed Expectations and Achieve Major Long-Term Goals?
TradingKey - As we head into 2026, many investors are questioning where Amazon (AMZN) fits into the technology world.
A Crash After a Surge: Why Silver Lost 40% in a Week?
TradingKey - Spot silver (XAGUSD) prices continue to decline. Silver plunged 20% on Thursday, breaking below $71 per ounce, with the sell-off intensifying on Friday as prices fell further below $64. Compared to the all-time high set on January 29, silver prices have retraced more than 40%, wiping out nearly all gains accumulated over the previous month.
Google Cloud Revenue Surges 48% in Q4 as CapEx Guidance Nearly Doubles: Why the 7.5% After-Hours Dip?
TradingKey - After the close on February 4 (ET), Google (GOOG, GOOGL) released stellar Q4 results: total revenue grew 18% year-over-year, hitting a new quarterly record after revenue first surpassed $100 billion in Q3. The primary highlight was Google Cloud, where Q4 revenue surged 48% year-over-yea
Is Bitcoin’s Four-Year Cycle Dead in 2026?
Is the Bitcoin 4-year cycle dead? After 2025 broke historical records with a red post-halving year, institutional analysts explore if the Bitcoin price has decoupled from the halving countdown. Analyze the impact of spot ETFs, global liquidity, and the roadmap to the 2028 halving in this 2026 market

