Top 3 Price Prediction Bitcoin, Ethereum, Ripple: BTC, ETH, and XRP consolidate before a potential breakout

- Bitcoin hovers around $85,600 on Monday after recovering 4.25% last week.
- Ethereum price finds support around the $1,861 level, suggesting a recovery on the cards.
- XRP trades around $2.41 on Monday after recovering nearly 7% in the previous week.
Bitcoin (BTC) hovers around $85,600 on Monday after recovering 4.25% last week. Ethereum (ETH) and Ripple (XRP) also followed in BTC’s footsteps, hovering around their key levels after recovering almost 7% each the previous week.
Bitcoin bulls aim for $90,000 mark
Bitcoin price broke and closed above its 200-day Exponential Moving Average (EMA) at around $85,502 last week but failed to find support around it. Moreover, it broke and closed above its 200-day EMA again on Sunday. At the time of writing on Monday, it hovers around $85,600.
If BTC finds support around its 200-day EMA, it could extend the recovery to retest its key psychological level of $90,000.
The Relative Strength Index (RSI) on the daily chart reads 48, pointing upward toward its neutral level of 50, indicating fading bearish momentum. The RSI must move above its neutral level of 50 for the recovery rally to be sustained. The Moving Average Convergence Divergence (MACD) indicator showed a bullish crossover on the daily chart last week, giving a buy signal and suggesting a bullish trend ahead. Additionally, it shows rising green histogram levels above its neutral level of zero, indicating strength in upward momentum.
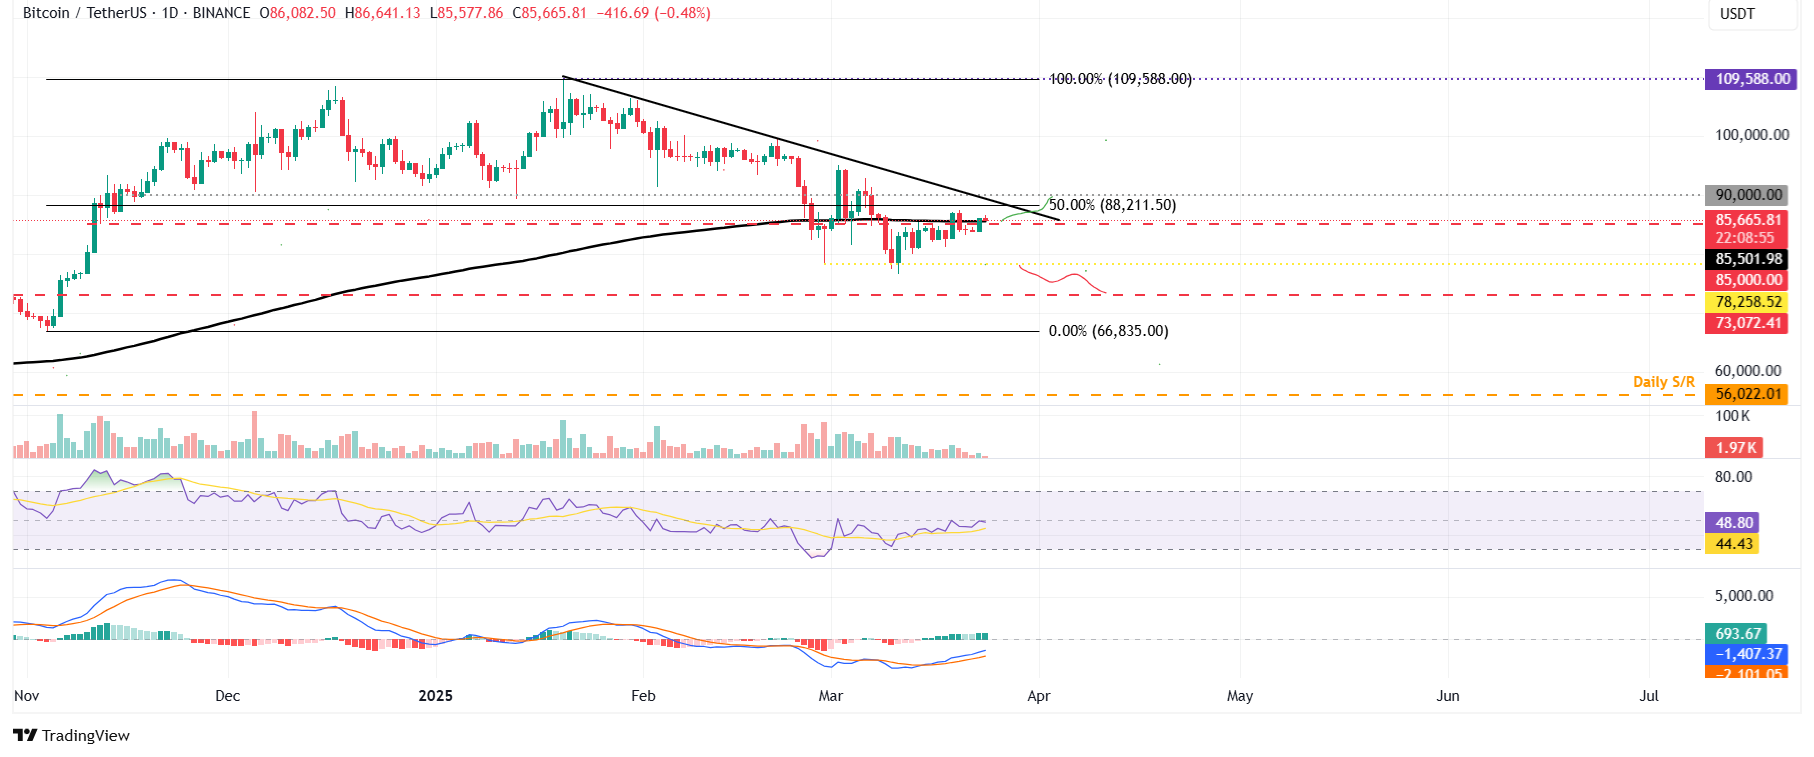
BTC/USDT daily chart
However, if BTC fails to find support around its 200-day EMA and closes below $85,000, it could extend the decline to retest its next support level at $78,258.
Ethereum could extend its recovery if the $1,861 level holds
Ethereum price was retested, and support was found around its daily level of $1,861 for the last two weeks, and it recovered nearly 7% last week. At the time of writing on Monday, it hovers around $1,980.
If the daily support around $1,861 holds, the ETH price could extend the recovery to retest its March 7 high of $2,258.
The RSI on the daily chart reads 40, approaching its neutral level of 50, indicating fading bearish momentum. However, the RSI must move above its neutral level of 50 for the recovery rally to be sustained. The MACD indicator showed a bullish crossover on the daily chart last week, giving a buy signal and suggesting a bullish trend ahead. Additionally, it shows rising green histogram levels above its neutral level of zero, indicating strength in upward momentum.
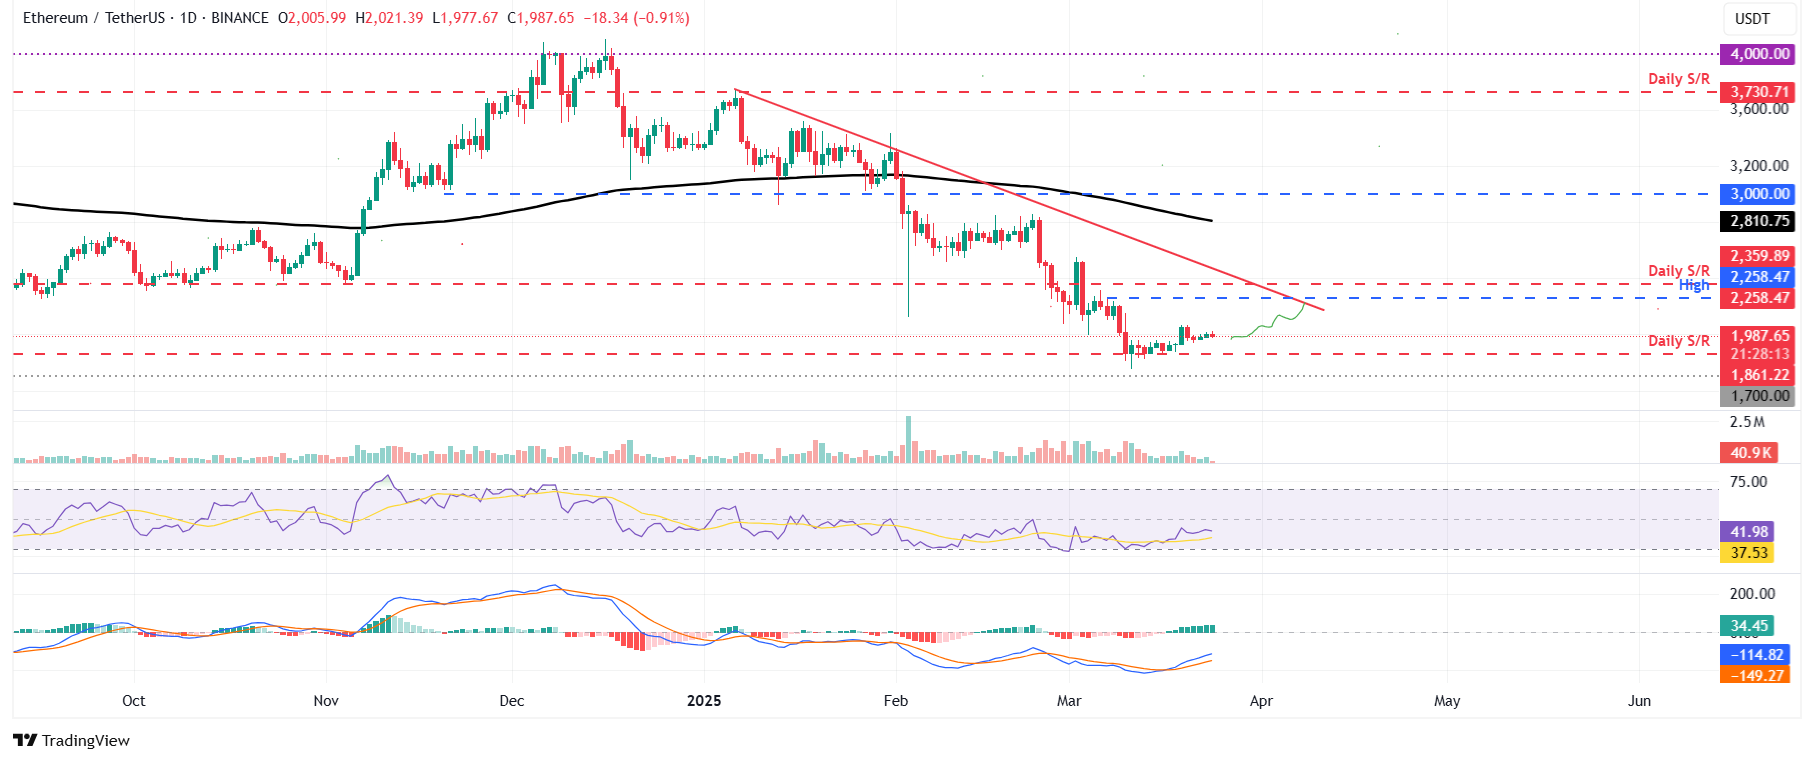
ETH/USDT daily chart
However, if ETH breaks and closes below the daily support at $1,861, it could extend the decline to retest the next support level at $1,700.
Ripple could recover if the break above 100-day EMA is sustained
Ripple price broke above its 100-day EMA at $2.31 last week and recovered almost 7%. At the time of writing on Monday, it hovers around $2.42.
If the 100-day EMA around $2.42 continues to hold, it could extend the recovery to retest its next resistance level at $2.72.
The RSI on the daily chart reads 51, hovering around the neutral level of 50, indicating indecisiveness among the traders. The RSI must point upward and move above its neutral level of 50 to sustain the bullish momentum. The MACD indicator showed a bullish crossover on the daily chart last week, giving a buy signal and suggesting a bullish trend ahead.
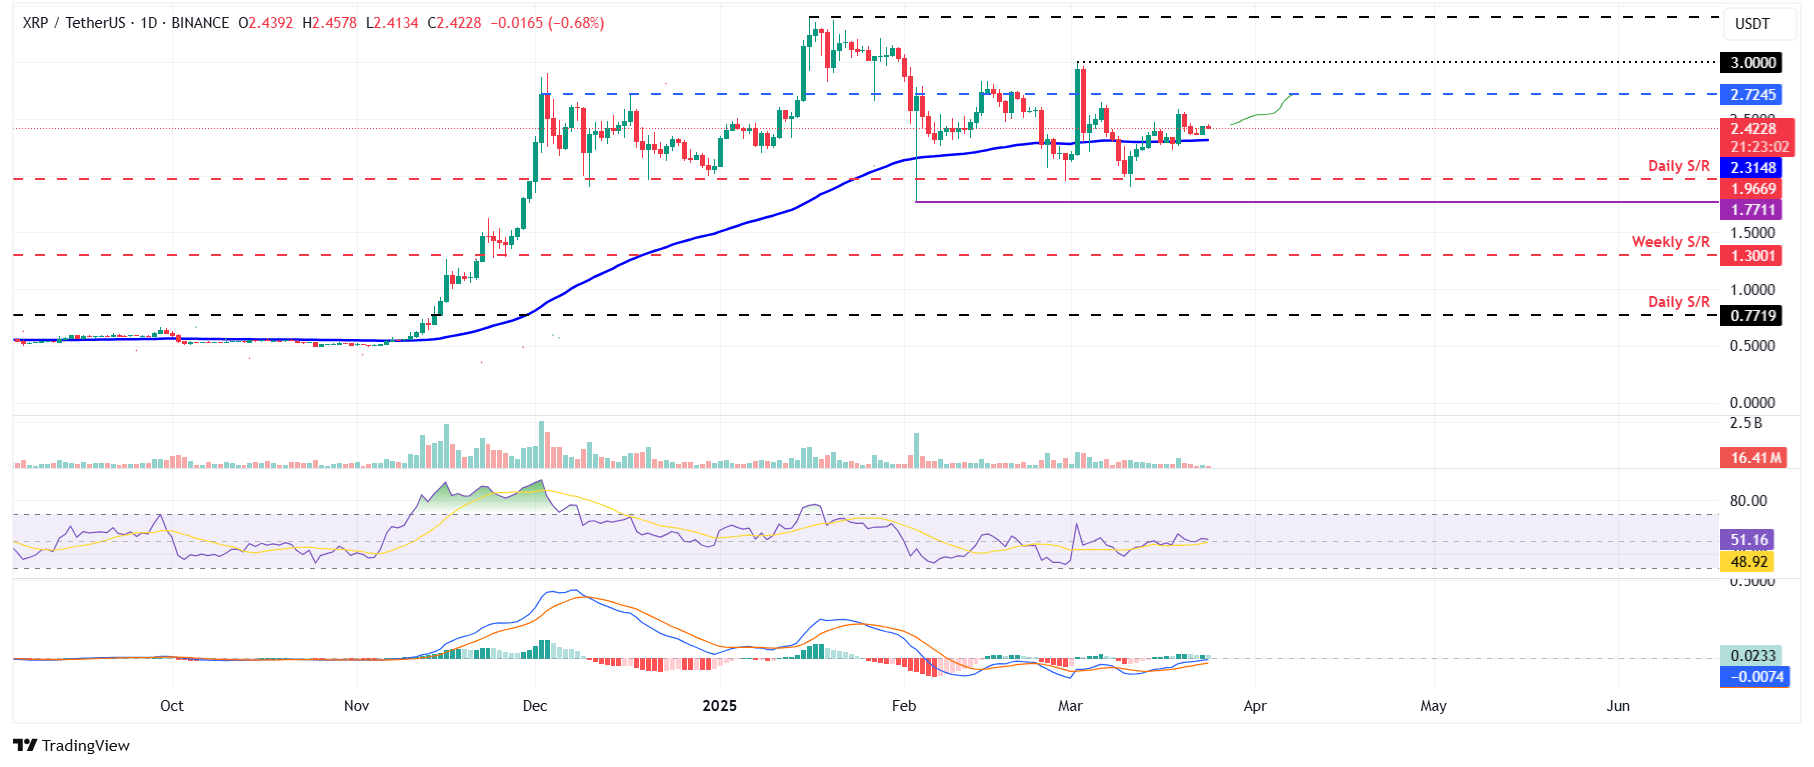
XRP/USDT daily chart
However, if XRP fails to find support around its 100-day EMA and closes below, it could extend an additional decline to test its next support level at $1.96.
Bitcoin, altcoins, stablecoins FAQs
Bitcoin is the largest cryptocurrency by market capitalization, a virtual currency designed to serve as money. This form of payment cannot be controlled by any one person, group, or entity, which eliminates the need for third-party participation during financial transactions.
Altcoins are any cryptocurrency apart from Bitcoin, but some also regard Ethereum as a non-altcoin because it is from these two cryptocurrencies that forking happens. If this is true, then Litecoin is the first altcoin, forked from the Bitcoin protocol and, therefore, an “improved” version of it.
Stablecoins are cryptocurrencies designed to have a stable price, with their value backed by a reserve of the asset it represents. To achieve this, the value of any one stablecoin is pegged to a commodity or financial instrument, such as the US Dollar (USD), with its supply regulated by an algorithm or demand. The main goal of stablecoins is to provide an on/off-ramp for investors willing to trade and invest in cryptocurrencies. Stablecoins also allow investors to store value since cryptocurrencies, in general, are subject to volatility.
Bitcoin dominance is the ratio of Bitcoin's market capitalization to the total market capitalization of all cryptocurrencies combined. It provides a clear picture of Bitcoin’s interest among investors. A high BTC dominance typically happens before and during a bull run, in which investors resort to investing in relatively stable and high market capitalization cryptocurrency like Bitcoin. A drop in BTC dominance usually means that investors are moving their capital and/or profits to altcoins in a quest for higher returns, which usually triggers an explosion of altcoin rallies.
Related Articles
Amazon Stock Predictions for 2026 to 2030: Will They Exceed Expectations and Achieve Major Long-Term Goals?
TradingKey - As we head into 2026, many investors are questioning where Amazon (AMZN) fits into the technology world.
A Crash After a Surge: Why Silver Lost 40% in a Week?
TradingKey - Spot silver (XAGUSD) prices continue to decline. Silver plunged 20% on Thursday, breaking below $71 per ounce, with the sell-off intensifying on Friday as prices fell further below $64. Compared to the all-time high set on January 29, silver prices have retraced more than 40%, wiping out nearly all gains accumulated over the previous month.
Is Bitcoin’s Four-Year Cycle Dead in 2026?
Is the Bitcoin 4-year cycle dead? After 2025 broke historical records with a red post-halving year, institutional analysts explore if the Bitcoin price has decoupled from the halving countdown. Analyze the impact of spot ETFs, global liquidity, and the roadmap to the 2028 halving in this 2026 market
Disney Trend Forecast: Disney FY26 First Quarter Net Profit Falls 6% Stock Price Slumps 7.4% Can Stock Price Continue to Rise in 2026?
TradingKey - At the start of 2026, global entertainment giant Disney (DIS) faced a disappointing start to the year. Its Q1 FY2026 earnings report showed that revenue grew 5% year-on-year to $25.98 billion, seemingly achieving steady growth; however, net profit fell 6% year-on-year to $2.4 billion. N