

Tron Price Forecast: TRX founder Justin Sun announces collaboration with Solana Blockchain

- Tron price edges slightly down around the $0.23 level on Wednesday after rallying nearly 12% in the last two days.
- TRX founder Justin Sun announces the upcoming expansion with Solana blockchain.
- The technical outlook suggests a rally continuation, targeting the $0.27 mark.
Tron (TRX) price edges slightly down, trading at $0.23 on Wednesday after rallying nearly 12% in the last two days. The recent announcement by TRX founder Justin Sun regarding Tron's upcoming expansion with the Solana blockchain has sparked excitement and fueled the current rally. The technical outlook suggests a rally continuation, targeting the $0.27 mark.
Justin Sun announces collaboration with Solana blockchain
Tron founder Justin Sun announced on Tuesday that the TRX token will soon be on the Solana blockchain. This news has generated excitement in the crypto community, causing TRX to surge nearly 8% that day, anticipating wider adoption of the TRX on Solana, interoperability, faster transactions, and attracting interest from investors and traders.
Integrating Solana could unlock new possibilities for decentralized finance (DeFi) applications and non-fungible tokens (NFTs), making TRX more attractive to developers and users. This could lead to increased liquidity and broader adoption of the TRX token.
Tron Price Forecast: Bulls aim for $0.27 mark
Tron price retested and found support around the 200-day Exponential Moving Average (EMA) at $0.21 on Monday and rallied 7.43% the next day. At the time of writing on Wednesday, it faces rejection from its weekly resistance level at $0.24 and trades around $0.23.
If TRX breaks and closes above its weekly resistance at $0.24, it could extend the rally to retest its next daily resitance at $0.27.
The Relative Strength Index (RSI) on the daily chart reads 52, above its neutral level of 50, indicating bullish momentum. The Moving Average Convergence Divergence (MACD) indicator also flipped to a bullish crossover on Wednesday, giving buy signals and suggesting a bullish trend ahead.
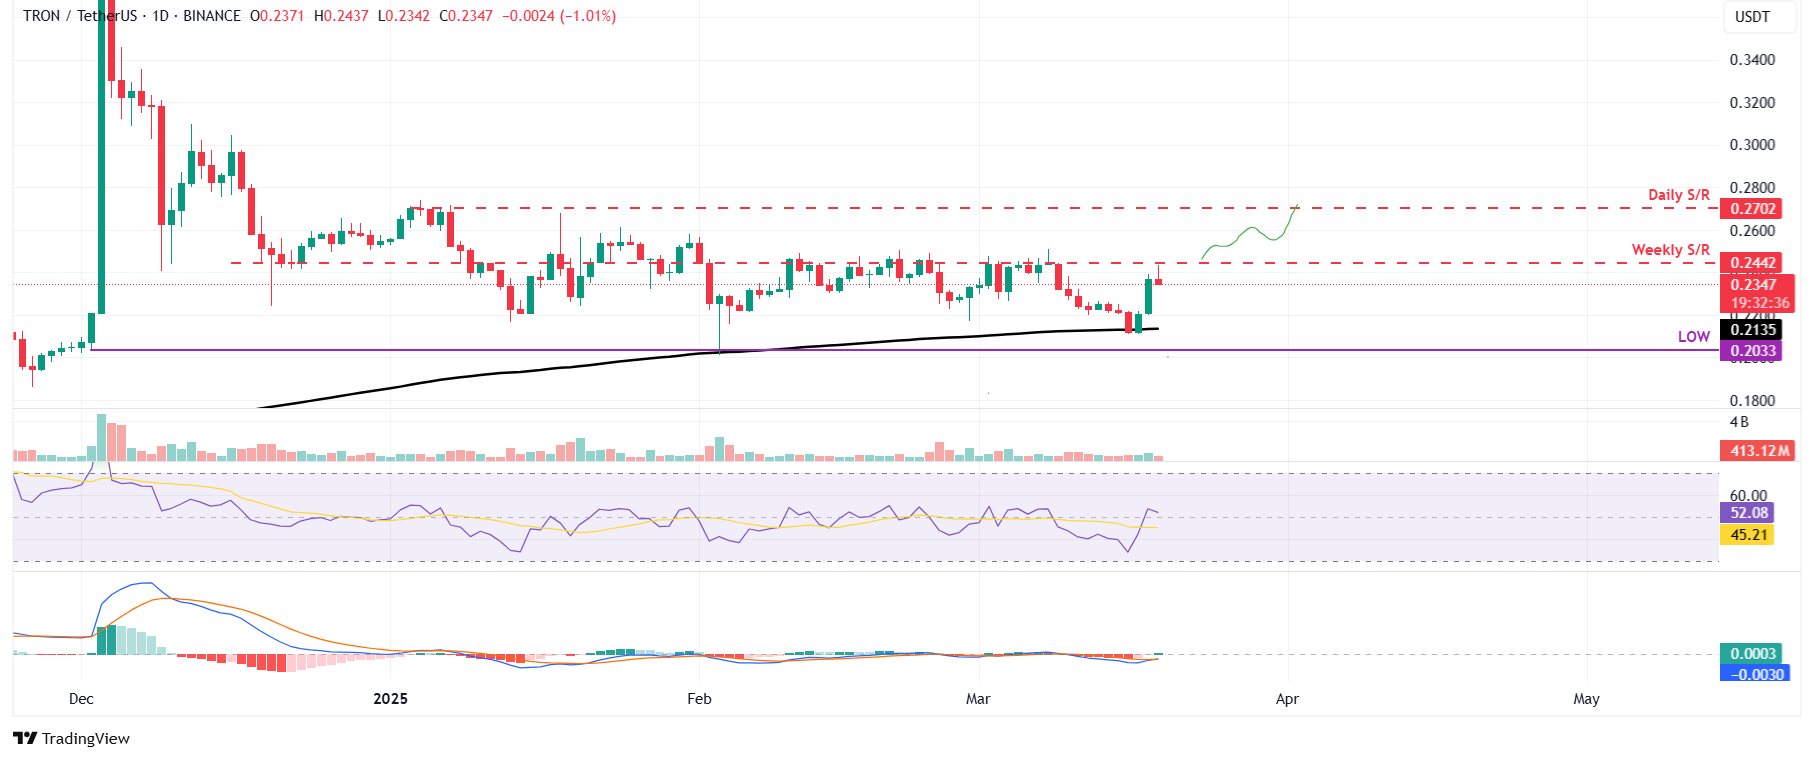
TRX/USDT daily chart
However, if TRX fails to find support around the 200-day EMA at $0.21 and closes below it, Tron could extend the decline to retest its December 2 low of $0.20.
Related Articles
$660B Capex Bill Triggers $900B Wipeout: Why Apple Shares Outperform Amazon and Google Despite AI Lag
Based on financial disclosures, the combined 2026 capital expenditure forecasts for Meta, Amazon, Google, and Microsoft are projected to reach $660 billion. This figure is not only significantly higher than the $410 billion forecast for 2025 and $245 billion for 2024, but even surpasses the GDP of I
Amazon Stock Predictions for 2026 to 2030: Will They Exceed Expectations and Achieve Major Long-Term Goals?
TradingKey - As we head into 2026, many investors are questioning where Amazon (AMZN) fits into the technology world.
A Crash After a Surge: Why Silver Lost 40% in a Week?
TradingKey - Spot silver (XAGUSD) prices continue to decline. Silver plunged 20% on Thursday, breaking below $71 per ounce, with the sell-off intensifying on Friday as prices fell further below $64. Compared to the all-time high set on January 29, silver prices have retraced more than 40%, wiping out nearly all gains accumulated over the previous month.
Is Bitcoin’s Four-Year Cycle Dead in 2026?
Is the Bitcoin 4-year cycle dead? After 2025 broke historical records with a red post-halving year, institutional analysts explore if the Bitcoin price has decoupled from the halving countdown. Analyze the impact of spot ETFs, global liquidity, and the roadmap to the 2028 halving in this 2026 market

