

Chainlink Price Forecast: LINK bulls target a 30% upside as key support holds strong

- Chainlink price is extending its gains on Thursday after rallying nearly 13% in the last two days.
- On-chain data suggest a rally ahead as LINK's long-to-short ratio reaches its highest monthly level and its funding rates are positive.
- A weekly candlestick close below $16.59 would invalidate the bullish thesis.
Chainlink (LINK) extends its gains by more than 4% on Thursday, trading around $17.22 after rallying nearly 13% in the last two days. On-chain data suggest a rally ahead as LINK's long-to-short ratio reaches its highest monthly level and its funding rates are positive. The technical outlook suggests a rally continuation, targeting 30% additional gains ahead.
Chainlink bulls eye a 30% surge
Chainlink price retested and found support around its descending trendline (drawn by joining multiple highs since early November 2021) last week, and as of this week, it holds above this trendline. This trendline roughly coincides with the 50-week Exponential Moving Average (EMA) at $16.59 and the 61.8% Fibonacci retracement level at $16.91, making this level a key support zone. At the time of writing on Thursday, it trades above these support levels around $18.81.
If these support levels hold, LINK would extend the rally by 30% from its current level to retest its February 3 high of $22.05.
The Relative Strength Index (RSI) on the weekly chart has just slipped below its neutral level of 50, indicating mild bearish momentum. The RSI must move above its neutral level for the bullish momentum to be sustained.
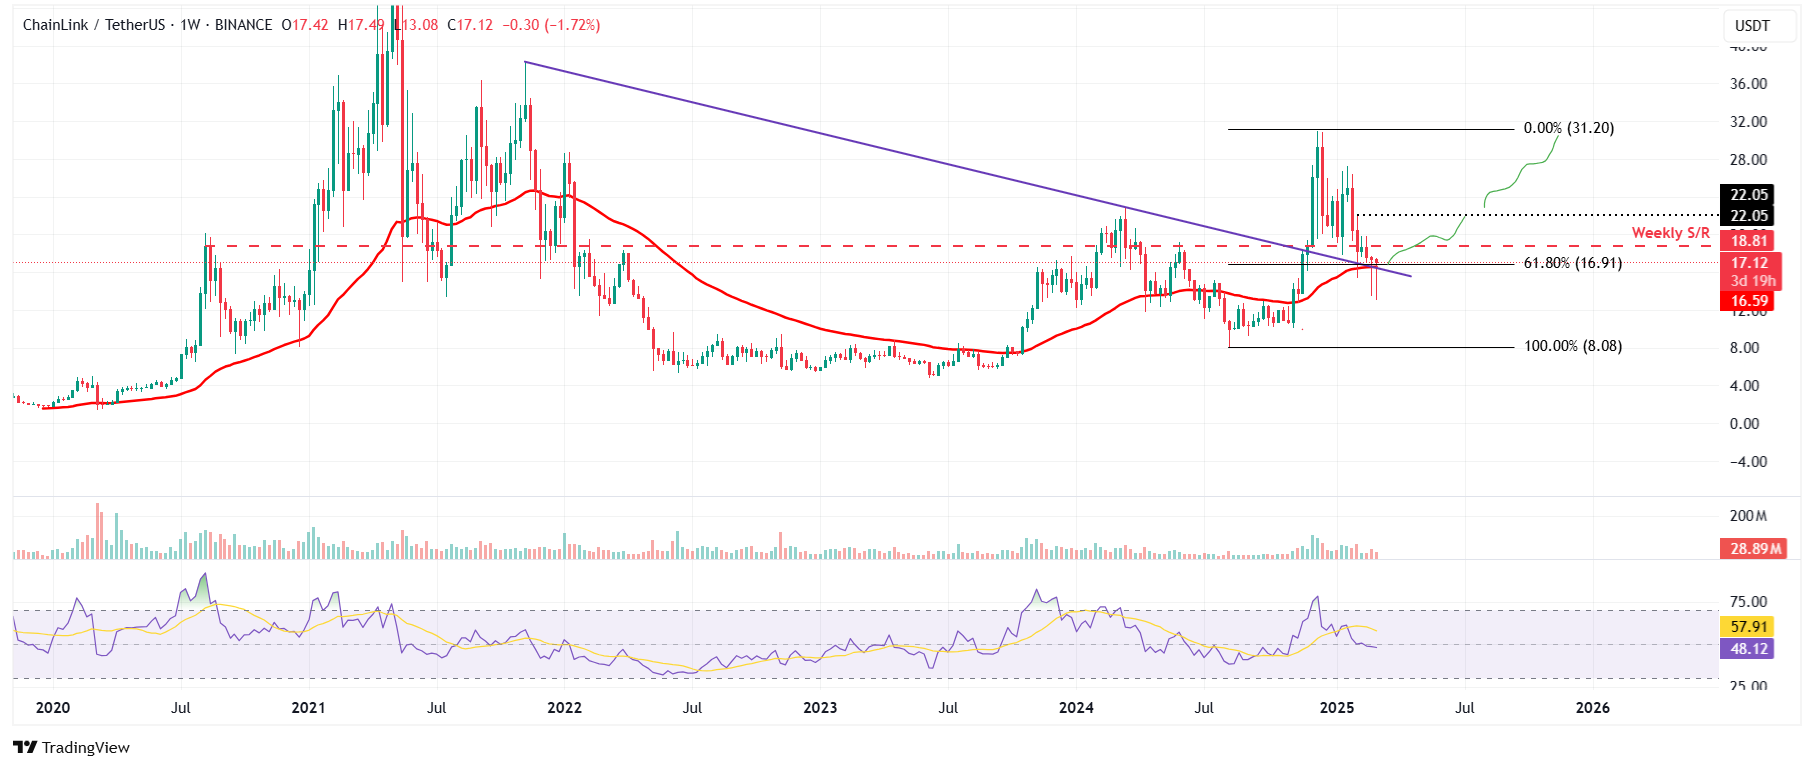
LINK/USDT weekly chart
Another bullish sign is Coinglass’ LINK long-to-short ratio, which reads 1.04, the highest level in over a month. This ratio above one reflects bullish sentiment in the markets as more traders are betting on the asset price to rise.
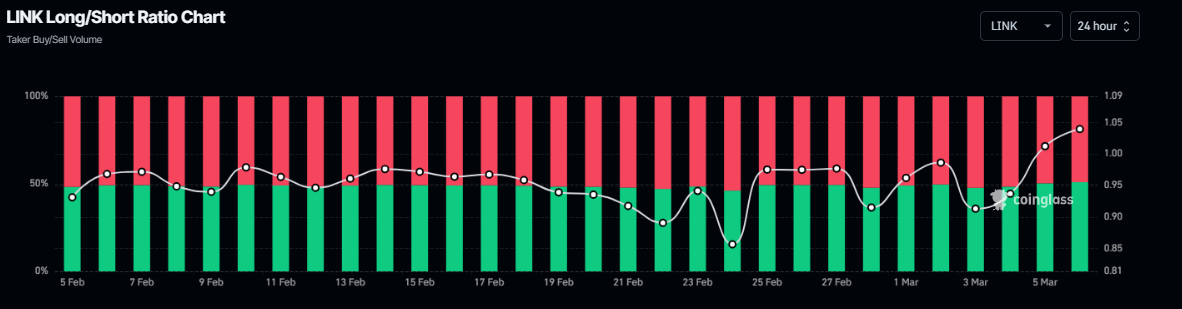
LINK long-to-short ratio chart. Source: Coinglass
Additionally, according to Coinglass's OI-Weighted Funding Rate data, the number of traders betting that the price of Chainlink will slide further is lower than that anticipating a price increase.
This index is based on the yields of futures contracts, which are weighted by their Open Interest (OI) rates. Generally, a positive rate (longs pay shorts) indicates bullish sentiment, while negative numbers (shorts pay longs) indicate bearishness.
In the case of LINK, this metric stands at 0.0018%, reflecting a positive rate and indicating that longs are paying shorts. This scenario often signifies bullish sentiment in the market, suggesting potential upward momentum on LINK’s price.
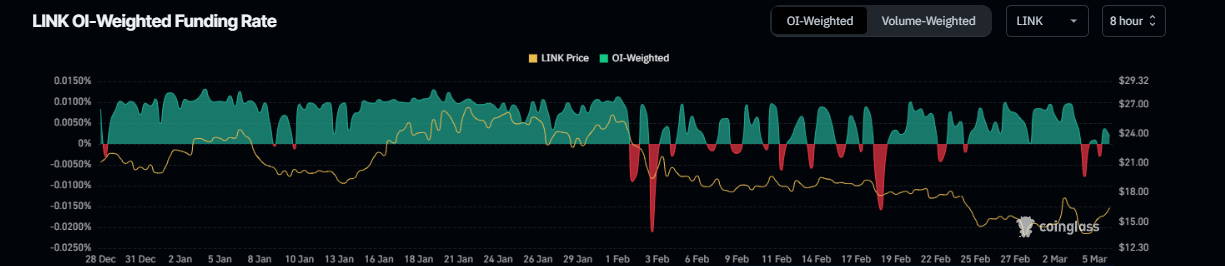
LINK OI-Weighted Funding Rate chart. Source: Coinglass
However, if the LINK weekly candlestick closes below the 50-week EMA at $16.59, the bullish thesis would be invalidated, leading to a decline to retest its Monday low of $13.08.
Related Articles
Amazon Stock Predictions for 2026 to 2030: Will They Exceed Expectations and Achieve Major Long-Term Goals?
TradingKey - As we head into 2026, many investors are questioning where Amazon (AMZN) fits into the technology world.
A Crash After a Surge: Why Silver Lost 40% in a Week?
TradingKey - Spot silver (XAGUSD) prices continue to decline. Silver plunged 20% on Thursday, breaking below $71 per ounce, with the sell-off intensifying on Friday as prices fell further below $64. Compared to the all-time high set on January 29, silver prices have retraced more than 40%, wiping out nearly all gains accumulated over the previous month.
Google Cloud Revenue Surges 48% in Q4 as CapEx Guidance Nearly Doubles: Why the 7.5% After-Hours Dip?
TradingKey - After the close on February 4 (ET), Google (GOOG, GOOGL) released stellar Q4 results: total revenue grew 18% year-over-year, hitting a new quarterly record after revenue first surpassed $100 billion in Q3. The primary highlight was Google Cloud, where Q4 revenue surged 48% year-over-yea
Is Bitcoin’s Four-Year Cycle Dead in 2026?
Is the Bitcoin 4-year cycle dead? After 2025 broke historical records with a red post-halving year, institutional analysts explore if the Bitcoin price has decoupled from the halving countdown. Analyze the impact of spot ETFs, global liquidity, and the roadmap to the 2028 halving in this 2026 market

