

Sui Price Forecast: SUI bears aiming for a 30% crash

- Sui’s price closes below its ascending trendline, indicating a correction ahead.
- The technical outlook suggests a pullback as momentum indicators show signs of weakness.
- Coinglass data shows that SUI’s long-to-short ratio reached the lowest level in over a month, reflecting a bearish sentiment.
Sui (SUI) price extends its decline, trading below $4.37 on Thursday after rejecting from its ascending trendline in the previous day. Coinglass data shows that SUI’s long-to-short ratio reached the lowest level in over a month, reflecting a bearish sentiment. Moreover, the technical outlook suggests a correction as momentum indicators show weakness, projecting a 30% crash ahead.
Sui price action shows signs of weakness
Sui’s price broke below the ascending trendline (drawn by connecting multiple daily close levels since November 26) on Sunday; however, it recovered slightly to retest the broken trendline on Tuesday and got rejected. A break below, retest and then rejection from the ascending trendline indicates the change in market structure from bullish to bearish. At the time of writing on Thursday, it continues to trade down around $4.37.
If SUI continues its pullback, it could extend the decline by 14% from its current levels to retest its 200-day Exponential Moving Average (EMA) at $3.75. A successful close below could extend an additional decline to test its next support level at $2.96, crashing 30% from its current level.
The Relative Strength Index (RSI) on the daily chart reads 45, below its neutral level of 50 and points downwards, indicating strong bearish momentum. Additionally, the Moving Average Convergence Divergence (MACD) indicator shows a bearish crossover on a daily basis. Moreover, it also shows rising red histogram bars below the neutral line zero, suggesting that the Sui price could experience downward momentum.
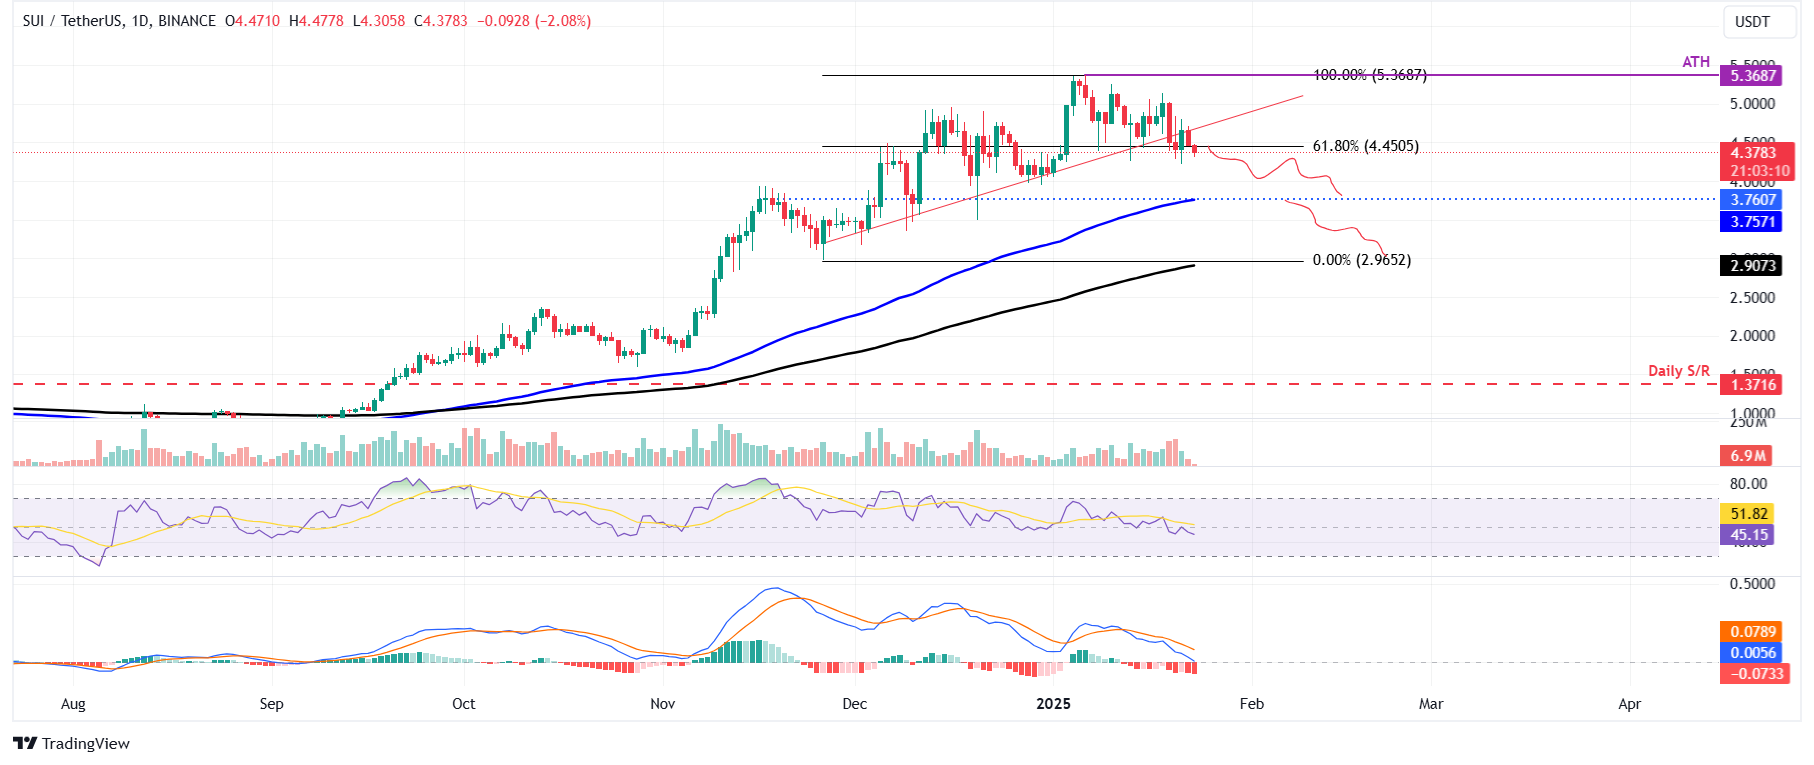
SUI/USDT daily chart
Another bearish sign is Coinglass’s Sui long-to-short ratio, which reads 0.79, the lowest level in over a month. This ratio below one reflects bearish sentiment in the markets as more traders are betting for the Sui price to fall.
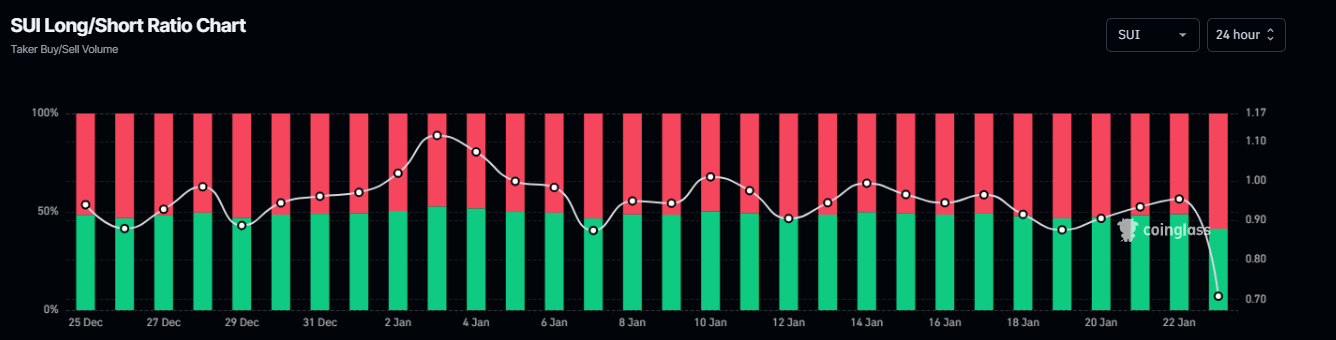
Sui long-to-short ratio chart. Source: Coinglass
Related Articles
$660B Capex Bill Triggers $900B Wipeout: Why Apple Shares Outperform Amazon and Google Despite AI Lag
Based on financial disclosures, the combined 2026 capital expenditure forecasts for Meta, Amazon, Google, and Microsoft are projected to reach $660 billion. This figure is not only significantly higher than the $410 billion forecast for 2025 and $245 billion for 2024, but even surpasses the GDP of I
Amazon Stock Predictions for 2026 to 2030: Will They Exceed Expectations and Achieve Major Long-Term Goals?
TradingKey - As we head into 2026, many investors are questioning where Amazon (AMZN) fits into the technology world.
A Crash After a Surge: Why Silver Lost 40% in a Week?
TradingKey - Spot silver (XAGUSD) prices continue to decline. Silver plunged 20% on Thursday, breaking below $71 per ounce, with the sell-off intensifying on Friday as prices fell further below $64. Compared to the all-time high set on January 29, silver prices have retraced more than 40%, wiping out nearly all gains accumulated over the previous month.
Is Bitcoin’s Four-Year Cycle Dead in 2026?
Is the Bitcoin 4-year cycle dead? After 2025 broke historical records with a red post-halving year, institutional analysts explore if the Bitcoin price has decoupled from the halving countdown. Analyze the impact of spot ETFs, global liquidity, and the roadmap to the 2028 halving in this 2026 market

