Altcoins Tron and Toncoin Price Prediction: TRX and TON show signs of weakness

- Tron and Toncoin prices extend the decline on Thursday after falling more than 6% this week.
- TRX and TON face rejection from key levels, suggesting double-digit cash ahead.
- Traders should be cautious as both altcoins show signs of weakness in momentum indicators.
Tron (TRX) and Toncoin (TON) prices extend their decline on Thursday after falling more than 6% this week. TRX and TON prices faced rejection from key levels, suggesting double-digit cash ahead. Furthermore, the technical outlook also supports a bearish trend as both altcoins show signs of weakness in momentum indicators.
Tron Price Forecast: Poised for a double-digit crash
Tron price faced rejection at the 61.8% Fibonacci retracement on Tuesday (drawn from the November 7 low of $0.159 to the December 4 high of $0.450) at $0.270 and declined 6.67% until Wednesday. At the time of writing on Thursday, it trades down around $0.244, below its 50-day Exponential Moving Average (EMA) support level of $0.248.
If TRX closes below the 50-day EMA at $0.248, it could extend the decline by 16.8% to test its December 2 low of $0.203.
The Relative Strength Index (RSI) reads 42, below its neutral level of 50, and points downwards, indicating strong bearish momentum. Additionally, the Moving Average Convergence Divergence (MACD) indicator also shows a bearish crossover on Tuesday, suggesting a sell signal and a downtrend.
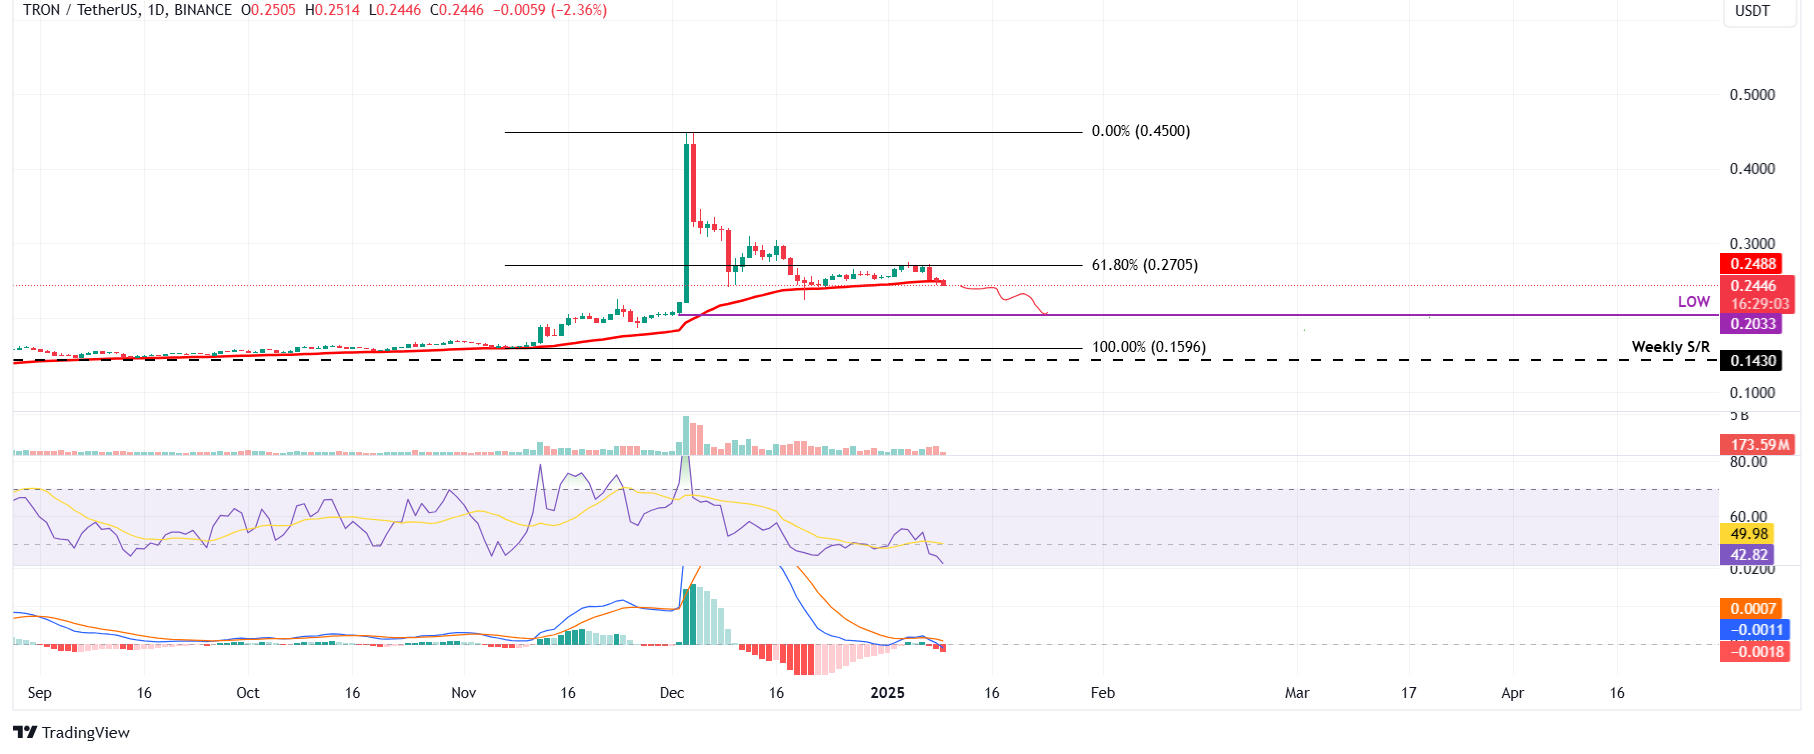
TRX/USDT daily chart
Toncoin price action shows signs of bearish momentum
Toncoin price was rejected from the 50-day EMA level of $5.72 on Tuesday and declined by 7% until Wednesday. At the time of writing on Thursday, it continues to edge down, trading around $5.20.
If TON continues its downward trend, it could extend the decline by 11.5% from its current level to retest its next daily support at $4.60.
Like TRX, Tron’s RSI indicator trades below its neutral level of 50 and points downwards, indicating strong bearish momentum. Moreover, the MACD shows a bearish crossover on Tuesday.
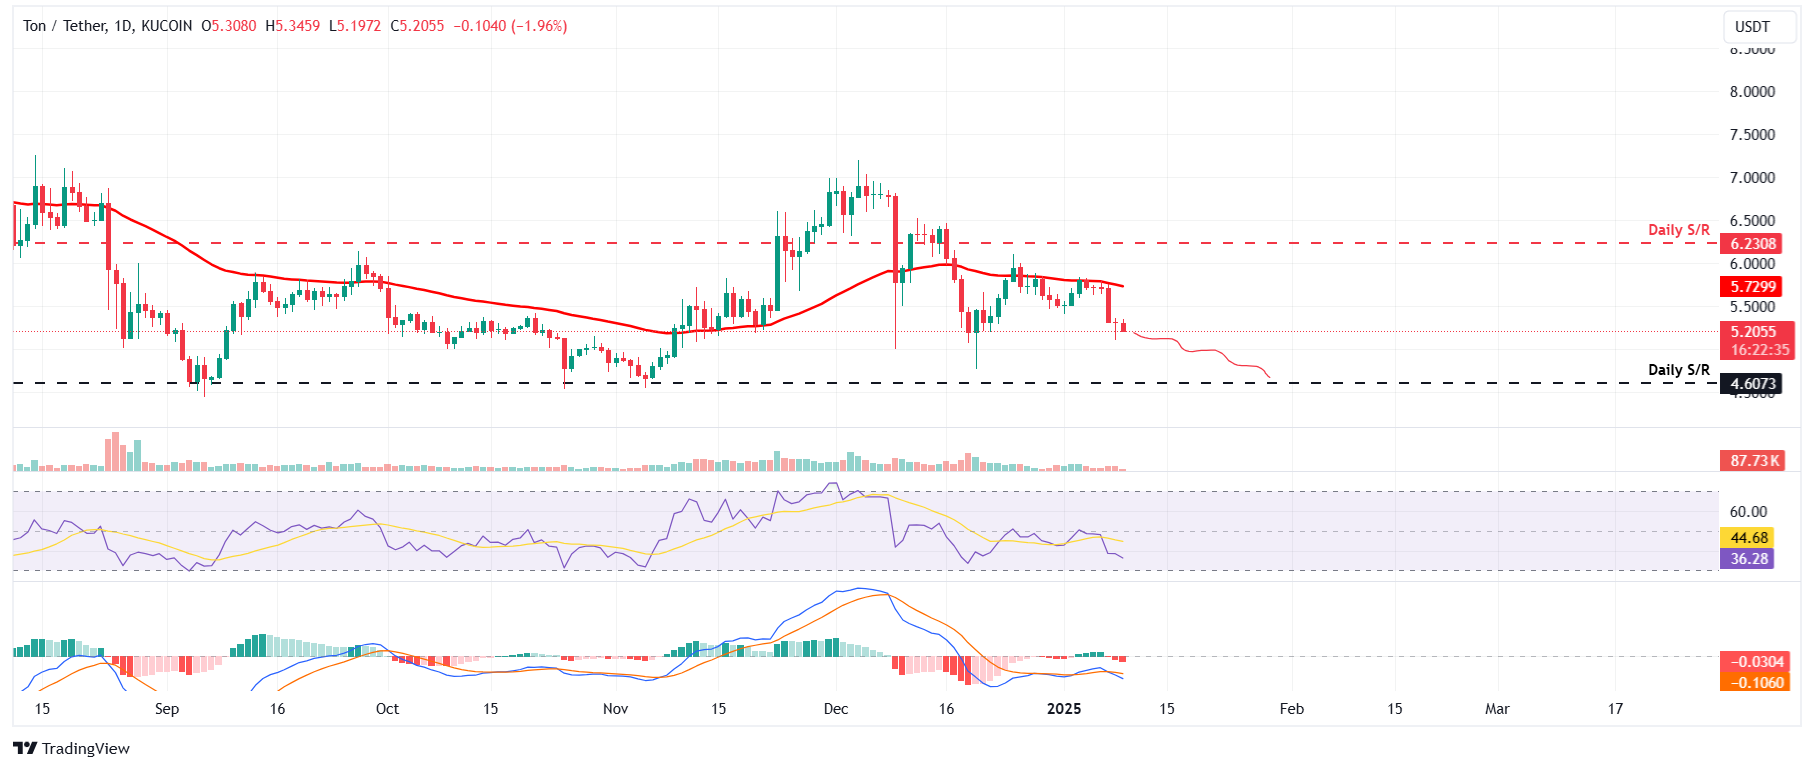
TON/USDT daily chart
Related Articles
Amazon Stock Predictions for 2026 to 2030: Will They Exceed Expectations and Achieve Major Long-Term Goals?
TradingKey - As we head into 2026, many investors are questioning where Amazon (AMZN) fits into the technology world.
A Crash After a Surge: Why Silver Lost 40% in a Week?
TradingKey - Spot silver (XAGUSD) prices continue to decline. Silver plunged 20% on Thursday, breaking below $71 per ounce, with the sell-off intensifying on Friday as prices fell further below $64. Compared to the all-time high set on January 29, silver prices have retraced more than 40%, wiping out nearly all gains accumulated over the previous month.
Is Bitcoin’s Four-Year Cycle Dead in 2026?
Is the Bitcoin 4-year cycle dead? After 2025 broke historical records with a red post-halving year, institutional analysts explore if the Bitcoin price has decoupled from the halving countdown. Analyze the impact of spot ETFs, global liquidity, and the roadmap to the 2028 halving in this 2026 market
Disney Trend Forecast: Disney FY26 First Quarter Net Profit Falls 6% Stock Price Slumps 7.4% Can Stock Price Continue to Rise in 2026?
TradingKey - At the start of 2026, global entertainment giant Disney (DIS) faced a disappointing start to the year. Its Q1 FY2026 earnings report showed that revenue grew 5% year-on-year to $25.98 billion, seemingly achieving steady growth; however, net profit fell 6% year-on-year to $2.4 billion. N