

Stellar bulls aim for double-digit rally ahead

- Stellar price trades above $0.45 on Friday after rallying more than 32% so far this week.
- On-chain data paints a bullish picture as XLM Open Interest and TVL are rising.
- A daily candlestick close below $0.31 would invalidate the bullish thesis.
Stellar (XLM) extends its gains, trading above $0.45 on Friday after rallying more than 32% this week. On-chain data indicates further rally as XLM’s Open Interest (OI) and Total Value Locked (TVL) rise. Additionally, the technical outlook suggests a rally continuation projection of further 40% gains.
Stellar bulls aim for a 40% rally
Stellar price found support around the $0.31 daily level on Monday and rallied more than 27% in the next three days. At the time of writing on Friday, it continues to trade higher by 4%, around $0.45.
If XLM continues its upward trend, it would extend the rally by 40% to retest its November 24, 2024, high of $0.63.
The Relative Strength Index (RSI) on the daily chart reads 60, above its neutral value of 50 and points upwards, indicating a bullish momentum. The daily chart's Moving Average Convergence Divergence (MACD) indicator shows a bullish crossover on Tuesday. The MACD (blue line) crosses over the signal line (orange line), giving buy signals and suggesting an upward trend.
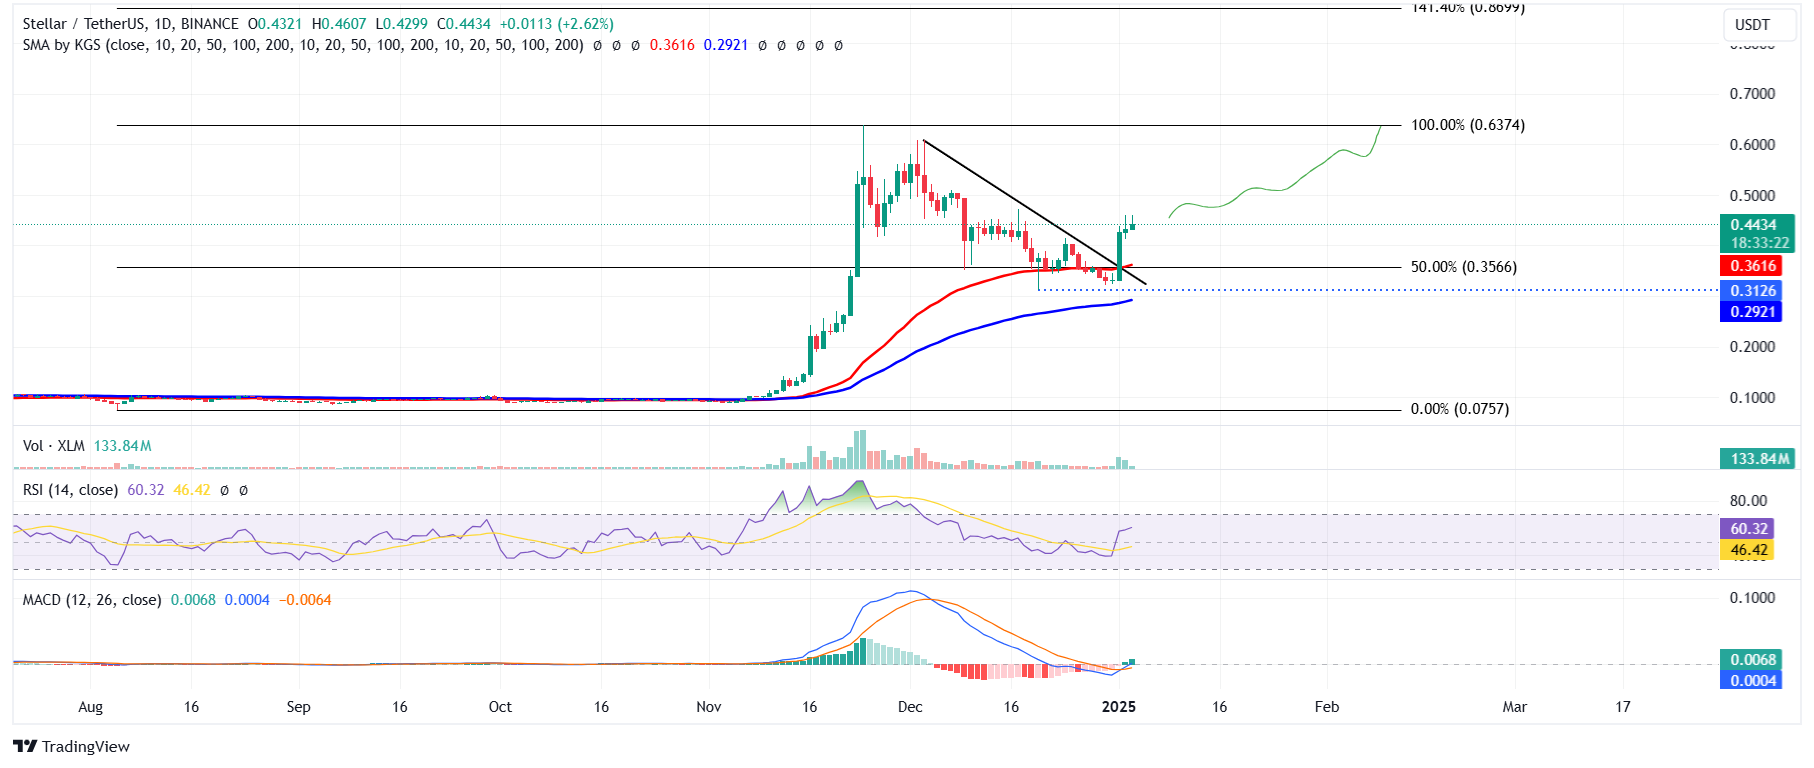
XLM/USDT daily chart
Coinglass’s data shows that the futures’ Open Interest (OI) in XLM at exchanges rose from $126.86 million on Wednesday to $274.11 million on Friday, reaching the highest level since December 10, 2024. An increasing OI represents new or additional money entering the market and new buying, which suggests a rally ahead in the Stellar price.
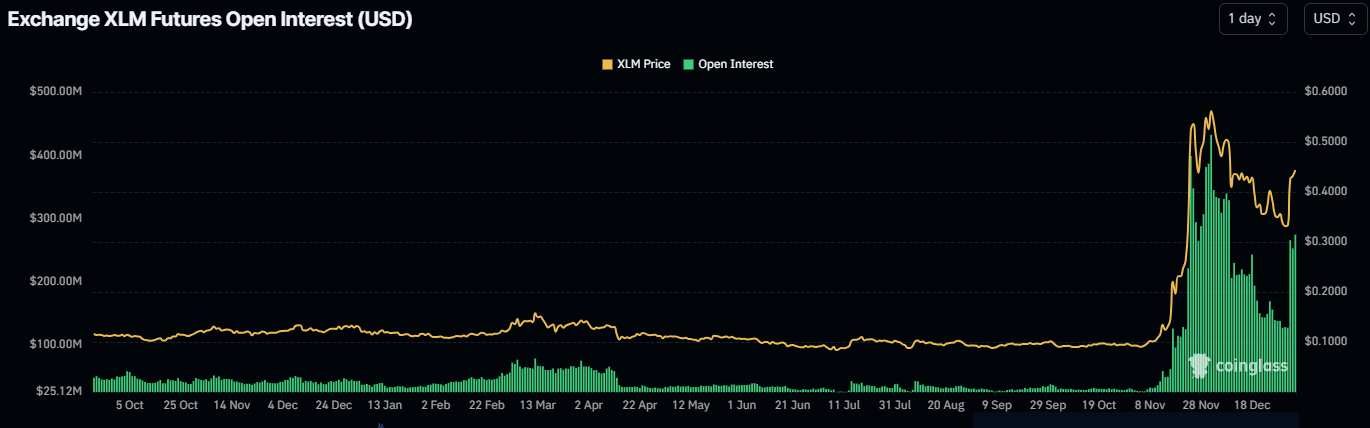
Stellar Open Interest chart. Source: Coinglass
Data from crypto intelligence tracker DefiLlama data shows XLM’s TVL increased from $44.95 million on Tuesday to $54.59 million on Friday and has been constantly rising since the end of December 2024.
This increase in TVL indicates growing activity and interest within the Stellar ecosystem. It suggests that more users deposit or utilize assets within XLM-based protocols, adding credence to the bullish outlook.
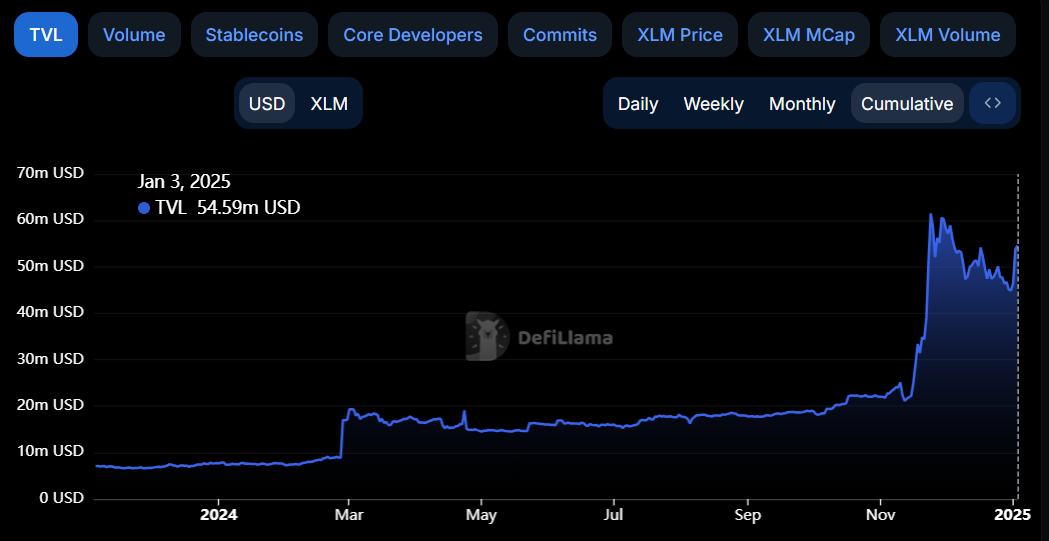
Stellar TVL chart. Source: DefiLlama
However, the bullish thesis would be invalidated if Stellar’s daily candlestick closes below $0.31; XLM would extend the decline to retest its next support level at $0.29, its 100-day Exponential Moving Average (EMA).
Related news
- Top 3 Price Prediction Bitcoin, Ethereum, Ripple: BTC, ETH and XRP eyes for a rally
- Could XRP surge to new highs in January 2025? First two days of trading suggest an upside bias
- These 5 altcoins are rallying ahead of $16 billion FTX creditor payout
Related Articles
$660B Capex Bill Triggers $900B Wipeout: Why Apple Shares Outperform Amazon and Google Despite AI Lag
Based on financial disclosures, the combined 2026 capital expenditure forecasts for Meta, Amazon, Google, and Microsoft are projected to reach $660 billion. This figure is not only significantly higher than the $410 billion forecast for 2025 and $245 billion for 2024, but even surpasses the GDP of I
Amazon Stock Predictions for 2026 to 2030: Will They Exceed Expectations and Achieve Major Long-Term Goals?
TradingKey - As we head into 2026, many investors are questioning where Amazon (AMZN) fits into the technology world.
A Crash After a Surge: Why Silver Lost 40% in a Week?
TradingKey - Spot silver (XAGUSD) prices continue to decline. Silver plunged 20% on Thursday, breaking below $71 per ounce, with the sell-off intensifying on Friday as prices fell further below $64. Compared to the all-time high set on January 29, silver prices have retraced more than 40%, wiping out nearly all gains accumulated over the previous month.
Is Bitcoin’s Four-Year Cycle Dead in 2026?
Is the Bitcoin 4-year cycle dead? After 2025 broke historical records with a red post-halving year, institutional analysts explore if the Bitcoin price has decoupled from the halving countdown. Analyze the impact of spot ETFs, global liquidity, and the roadmap to the 2028 halving in this 2026 market

