BNB Price Forecast: Hits new all-time high after launch of SprinBoard platform on Pancake Swap

- BNB price hovers around $727 on Thursday after reaching a new all-time high of $793 the previous day.
- PancakeSwap launched SpringBoard on Wednesday, a no-code platform for creating and launching tokens on the BNB Chain.
- The technical analysis projects a bullish pattern breakout targeting the $832 level.
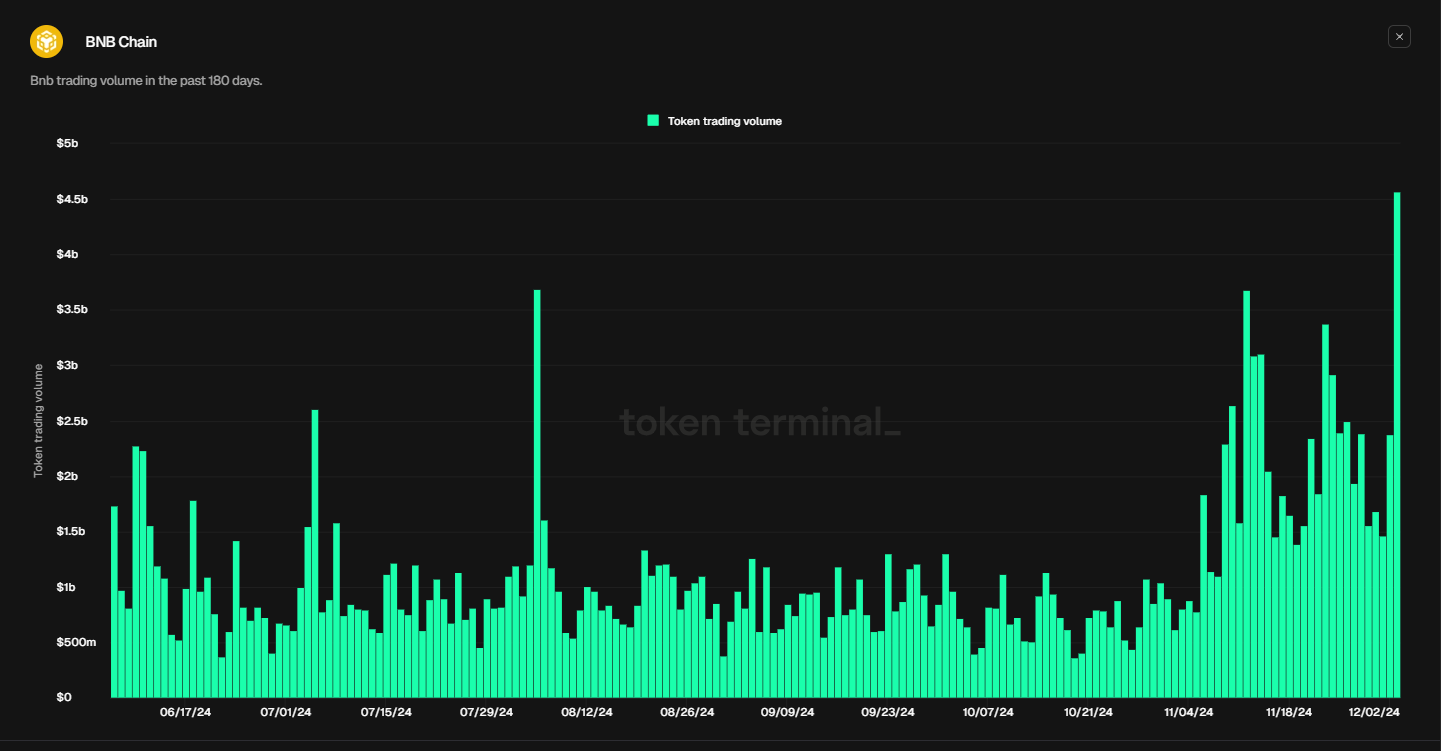
- On-chain data supports the bullish thesis as BNB’s daily trading volume surges above $4.5 billion, and active addresses also rise.
BNB (BNB) price faces a slight pullback on Thursday, trading around $727, after hitting a new all-time high of $793 the previous day. On Wednesday, the launch of PancakeSwap’s SpringBoard, a no-code platform for creating and launching tokens on BNB Chain, fueled the ongoing rally. Despite the recent correction, on-chain data support further price increases as both BNB’s daily trading volume and the active addresses are rising.
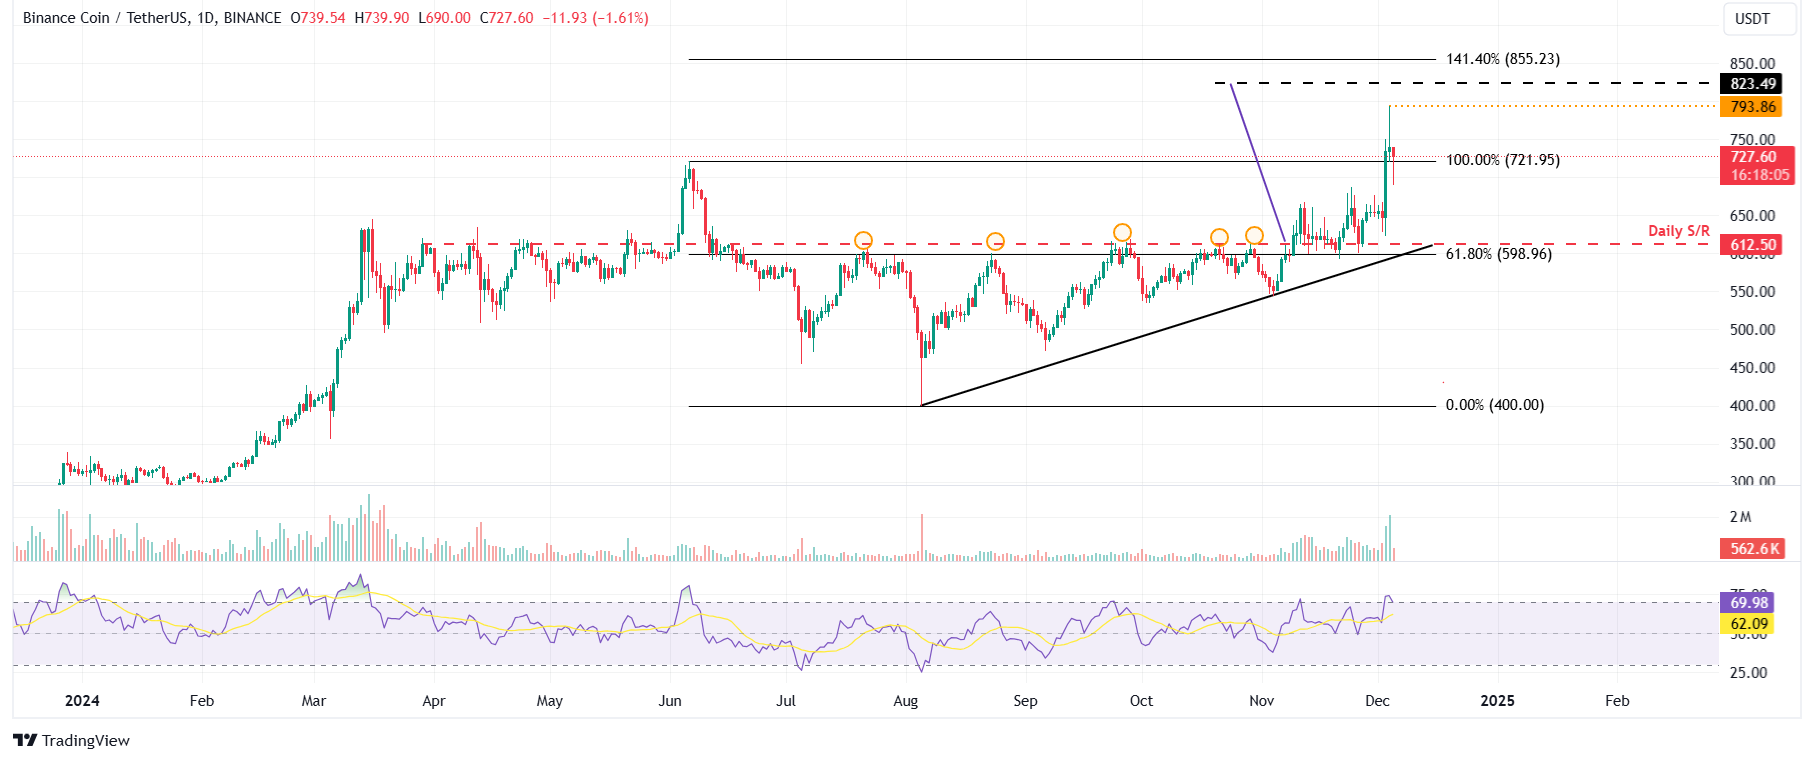
Technically, BNB price action broke out from a bullish pattern that sets a target of $832, a new all-time high.
BNB briefly soars as ecosystem continues to expand
PancakeSwap (CAKE), a Decentralized Exchange (DEX) built on top of Binance Smart Chain (BSC), announced on Wednesday the launch of SpringBoard, a no-code platform for creating and launching tokens on BNB. This announcement led to a rally in BNB price on Wednesday, breaking its June 6 all-time high (ATH) of $721.95 and reaching a new ATH of $793.86. The launch enhances the utility of BNB and attracts more projects to the platform.
Create and launch your own token directly on @PancakeSwap!
— BNB Chain (@BNBCHAIN) December 4, 2024
No coding skills needed and zero launch fee! Get the full details below https://t.co/T9TgVMEXSB
Binance Coin Price Forecast: Technical outlook targets $832
Binance Coin price closed above and found support around the breakout level at $612.50 of ascending triangle formation on November 26, rallying 21% in the next seven days. This pattern was created by drawing two trendlines from mid-July, connecting swing points on the daily chart between two higher lows and multiple equal highs. This technical pattern breakout favors the bulls, and the target is generally obtained by measuring the distance between the first daily high and the first daily low to the breakout point.
If BNB continues its upward momentum, it could extend the rally to form a new ATH of $823.49, the pattern’s technical target.

BNB/USDT daily chart
However, the Relative Strength Index (RSI) reads at 69, pointing downward from its overbought level of 70. Traders should be cautious when adding to their long positions because the chances of a price pullback are increasing. If the RSI continues moving down, BNB prices could fall sharply.
BNB’s on-chain shows strength
On-chain metrics support BNB’s bullish outlook. Token Terminal data shows a recent surge in traders’ interest and liquidity in the BNB’s chain. On Tuesday, BNB’s daily trading volume reached $4.56 billion, the highest level in six months.

BNB daily trading volume in the past 180 days. Source: Token Terminal
Another aspect bolstering the platform’s bullish outlook is the rise in daily active addresses. According to BscScan, active BNB Smart Chain addresses data, which track network activity over time, rose from 1.02 million on Sunday to 1.26 million on Wednesday, the highest level since August 14. This indicates that demand for BNB’s blockchain usage is increasing, which bodes well for BNB’s price outlook.
-638689817152669891.png)
BNB active addresses chart. Source: BscScan


