

ApeCoin surged more than 70% following the launch of ApeChain

- ApeCoin surged more than 70% following its new cross-chain bridge launch on Sunday.
- This bridge allows users to transfer APE tokens between Ethereum and Arbitrum networks and earn a yield on their ApeCoin balances.
- ApeCoin’s technical outlook suggests the continuation of the rally.
ApeCoin (APE) consolidates its gains on Monday after surging over 70% on Sunday following its new cross-chain bridge announcement on ApeChain. This bridge enables users to transfer APE tokens between the Ethereum and Arbitrum networks. Additionally, the technical outlook indicates a potential continuation of this rally.
ApeCoin launches new cross-chain bridge
ApeCoin announced its new cross-chain bridge on ApeChain on Sunday. Due to this announcement on Twitter, its native token APE rallied more than 70% on that day as it served as the gas token for transactions on the new platform. This event has led to an increase in utility and demand for APE.
The lights are on. pic.twitter.com/0JV9ImmkDA
— ApeCoin (@apecoin) October 19, 2024
The Santiment’s Volume graph below shows a significant uptick in APE’s trading volume, with an increase of over 250% in just a short period.
%20[11.08.57,%2021%20Oct,%202024]-638650931184628500.png)
APE trading volume chart. Source: Santiment
ApeCoin introduced an update to its smart contract, adopting LayerZero’s Omnichain Fungible Token (OFT) standard. It is now an OFT that can seamlessly transfer between ApeChain, Ethereum, and Arbitrum. Additionally, ApeCoin’s native yield mechanism, developed with Decent, enables users to earn a yield on their ApeCoin balances without manual actions while maintaining omnichain interoperability.
ApeCoin technical outlook
ApeCoin’s weekly chart shows it has closed above the weekly resistance level of $1.11 after rallying nearly 100% last week and faces resistance around the 50% price retracement (drawn from the March 13 high of $2.683 to the August 5 low of $0.475) at $1.51. On Monday, APE’s price consolidates its recent gains around that level.
If APE closes above $1.51, it could extend the rally by 50% to retest its next weekly resistance at $2.29. A close above this level could extend the rally to retest its March 13 high of $2.68.
The Relative Strength Index (RSI) momentum indicator on the weekly chart trades at 63, above its neutral level of 50 and still far below overbought conditions, suggesting bullish momentum is gaining traction.
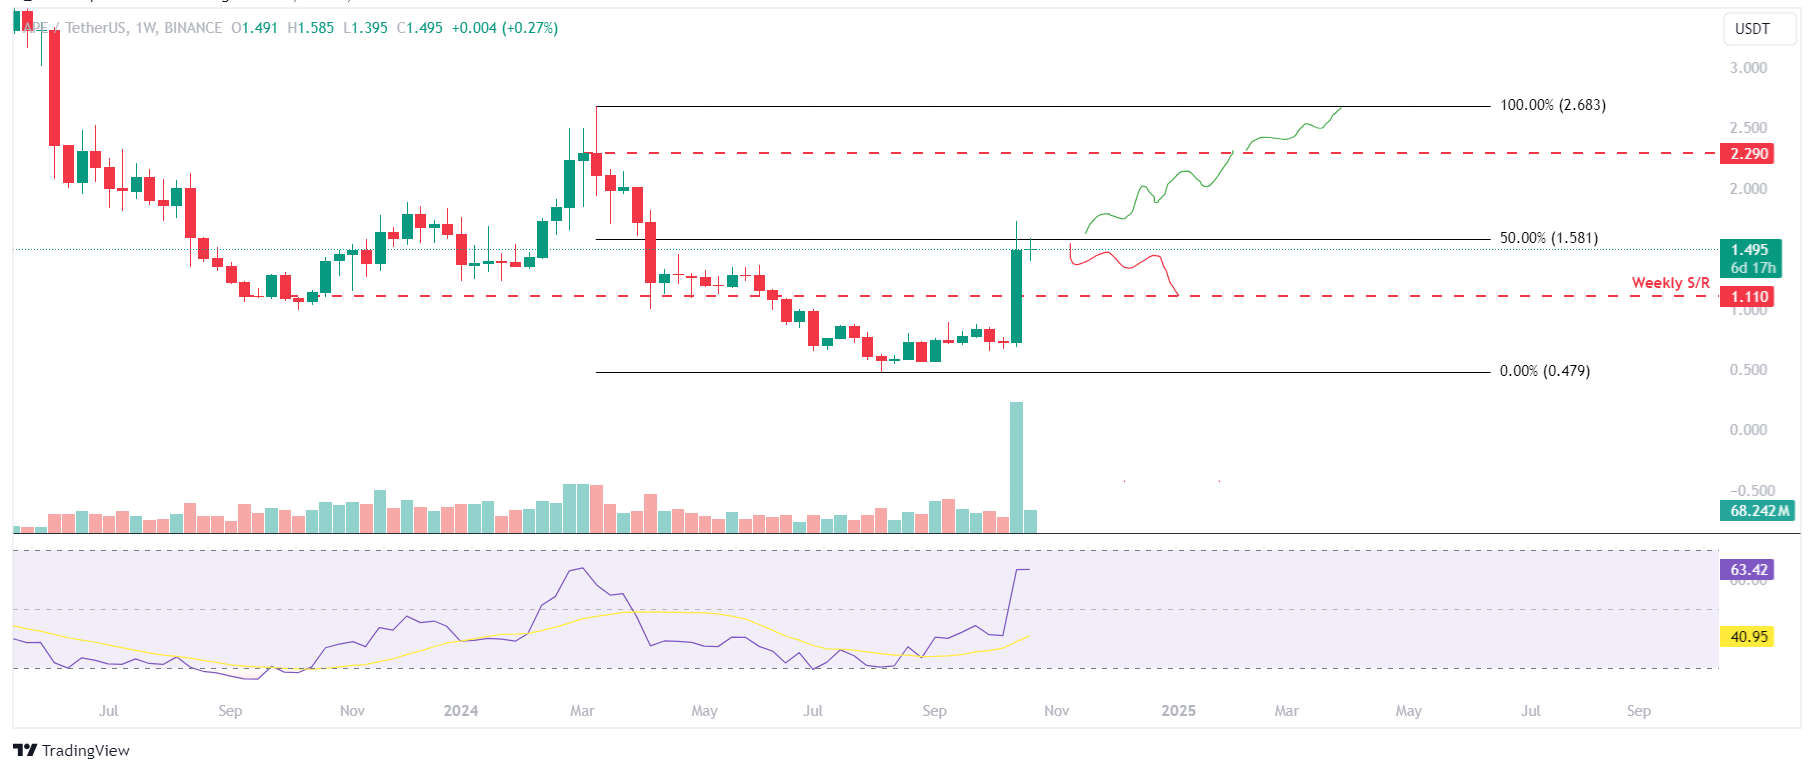
APE/USDT weekly chart
The daily chart also shows signs of strength after it broke and closed above the daily resistance level of $1.34 on Sunday. If APE continues rising, it could face the next resistance at its 61.8% Fibonacci retracement level at $1.84.
The RSI indicator on the daily chart is trading at 87, above the overbought level of 70. Traders are advised not to add to their long positions because there is a high chance of a pullback.
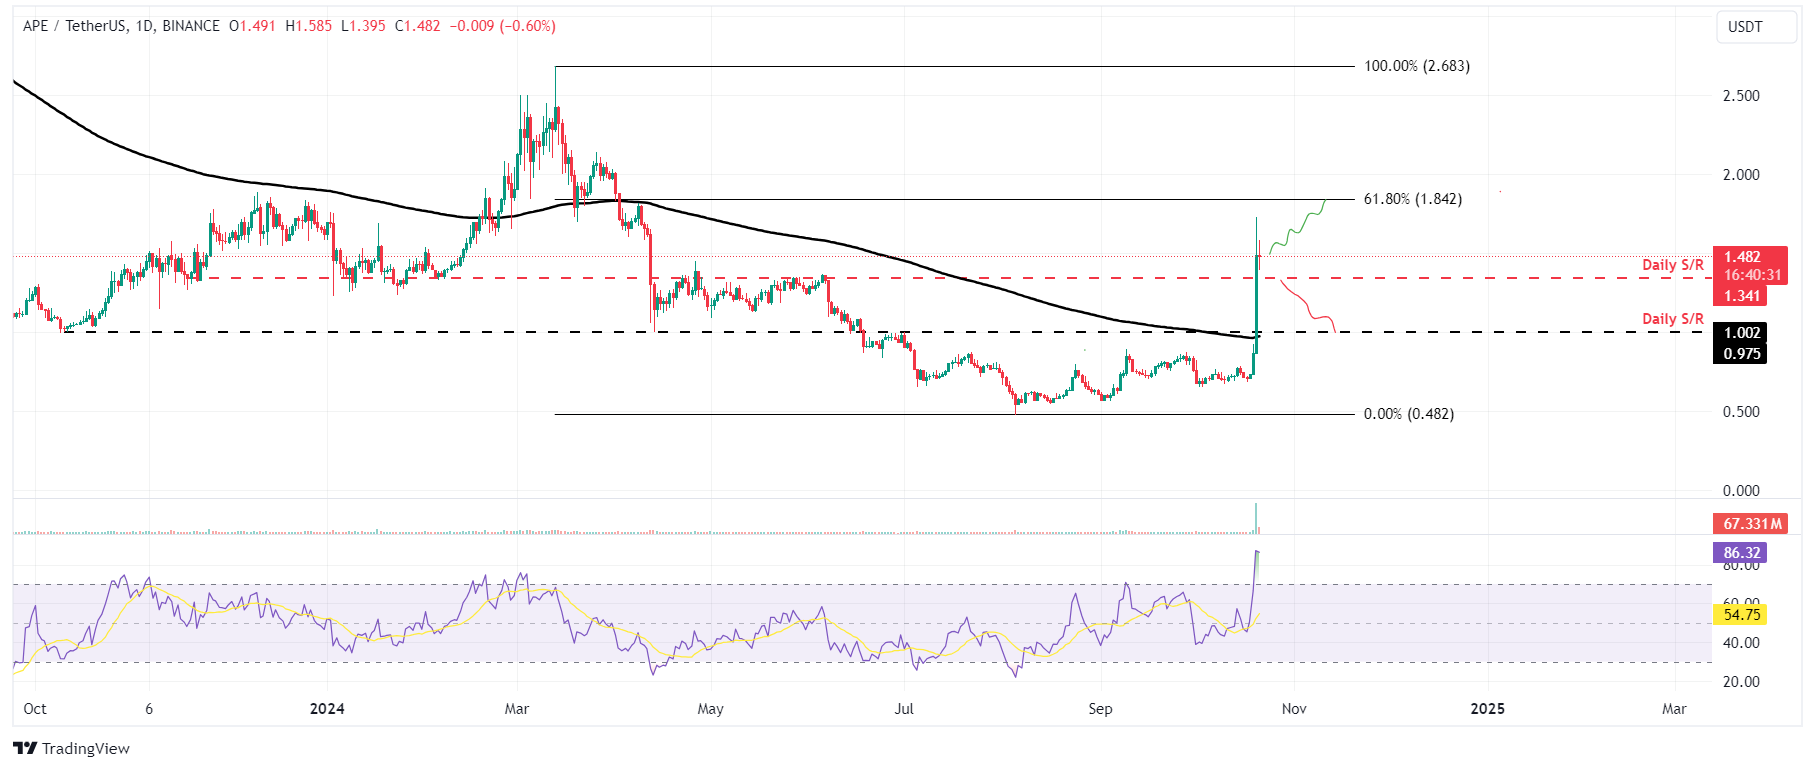
APE/USDT daily chart
However, if APE fails to find support around the daily support level of $1.34, it could extend the decline by 27% to retest its 200-day EMA support at $0.976, roughly coinciding with the next daily support level at $1.00.
Cryptocurrency metrics FAQs
The developer or creator of each cryptocurrency decides on the total number of tokens that can be minted or issued. Only a certain number of these assets can be minted by mining, staking or other mechanisms. This is defined by the algorithm of the underlying blockchain technology. On the other hand, circulating supply can also be decreased via actions such as burning tokens, or mistakenly sending assets to addresses of other incompatible blockchains.
Market capitalization is the result of multiplying the circulating supply of a certain asset by the asset’s current market value.
Trading volume refers to the total number of tokens for a specific asset that has been transacted or exchanged between buyers and sellers within set trading hours, for example, 24 hours. It is used to gauge market sentiment, this metric combines all volumes on centralized exchanges and decentralized exchanges. Increasing trading volume often denotes the demand for a certain asset as more people are buying and selling the cryptocurrency.
Funding rates are a concept designed to encourage traders to take positions and ensure perpetual contract prices match spot markets. It defines a mechanism by exchanges to ensure that future prices and index prices periodic payments regularly converge. When the funding rate is positive, the price of the perpetual contract is higher than the mark price. This means traders who are bullish and have opened long positions pay traders who are in short positions. On the other hand, a negative funding rate means perpetual prices are below the mark price, and hence traders with short positions pay traders who have opened long positions.
Related Articles
$660B Capex Bill Triggers $900B Wipeout: Why Apple Shares Outperform Amazon and Google Despite AI Lag
Based on financial disclosures, the combined 2026 capital expenditure forecasts for Meta, Amazon, Google, and Microsoft are projected to reach $660 billion. This figure is not only significantly higher than the $410 billion forecast for 2025 and $245 billion for 2024, but even surpasses the GDP of I
Amazon Stock Predictions for 2026 to 2030: Will They Exceed Expectations and Achieve Major Long-Term Goals?
TradingKey - As we head into 2026, many investors are questioning where Amazon (AMZN) fits into the technology world.
A Crash After a Surge: Why Silver Lost 40% in a Week?
TradingKey - Spot silver (XAGUSD) prices continue to decline. Silver plunged 20% on Thursday, breaking below $71 per ounce, with the sell-off intensifying on Friday as prices fell further below $64. Compared to the all-time high set on January 29, silver prices have retraced more than 40%, wiping out nearly all gains accumulated over the previous month.
Is Bitcoin’s Four-Year Cycle Dead in 2026?
Is the Bitcoin 4-year cycle dead? After 2025 broke historical records with a red post-halving year, institutional analysts explore if the Bitcoin price has decoupled from the halving countdown. Analyze the impact of spot ETFs, global liquidity, and the roadmap to the 2028 halving in this 2026 market

