NEAR Protocol price set for a rally as on-chain data shows positive trends


- NEAR Protocol price breaks above the descending trendline, eyeing a rally ahead.
- On-chain data shows that NEAR’s open interest and TVL value are rising, indicating new buying and greater blockchain usage.
- A daily candlestick close below $4.256 would invalidate the bullish thesis.
NEAR Protocol (NEAR) continues its gains on Tuesday after rallying more than 14% on Monday and breaking above the descending trendline. This bullish outlook is further supported by NEAR’s rising open interest and Total Value Locked (TVL), which suggests new buying and greater blockchain usage is occurring, all hinting at a rally ahead.
NEAR Protocol is poised for a rally as it breaks above its descending trendline
Near Protocol price broke above the descending trendline (drawn by connecting multiple high levels with a trendline from May 26) and rallied 14.4% on Monday. It also closed above its 100-day Exponential Moving Average (EMA) around $4.745, which had previously acted as a resistance barrier. Some retracement generally follows such a massive rally. At the time of writing on Tuesday, it trades at around $5.199.
If NEAR retraces, it could find support around the trendline breakout level and the 100-day EMA around $4.745. At this level, sideline traders looking for buying opportunities can enter positions.
If this support holds, NEAR’s price could rally 34% from $4.745 to retest its daily resistance level at $6.354.
The Relative Strength Index (RSI) indicator on the daily chart shows that the NEAR protocol is approaching its overbought level of 70, which currently trades at 68. If it enters the zone on a closing basis, traders will be advised not to add to their long positions, although the rally may continue. If it enters overbought and then exits back into the neutral level of 50, it will be a sign of a deeper correction.
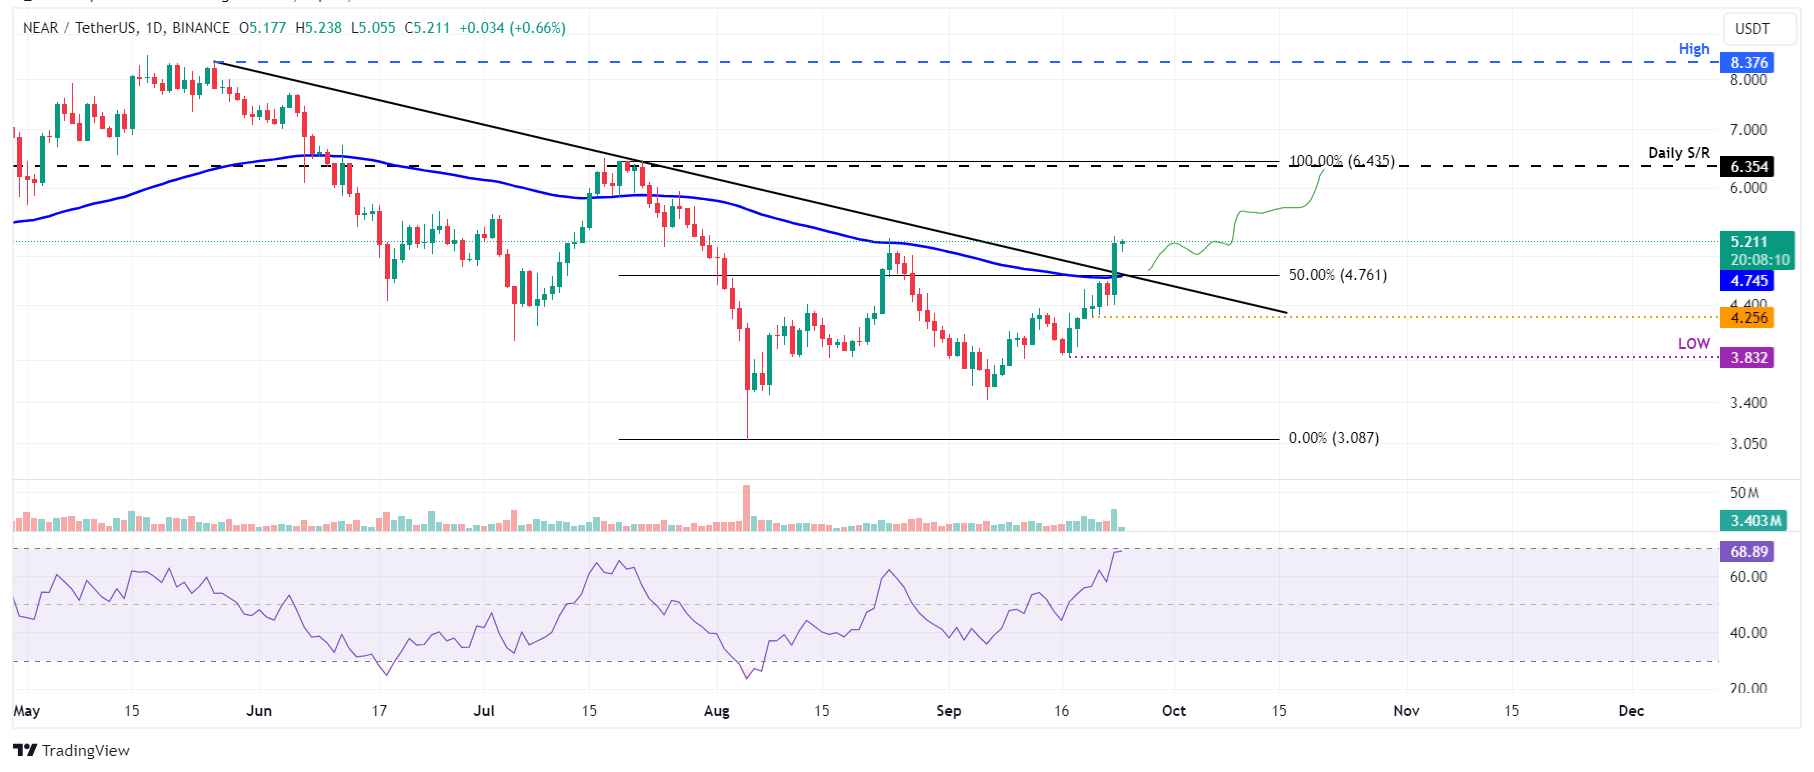
NEAR/USDT daily chart
NEAR Protocol’s on-chain data further supports the bullish thesis. Coinglass’s data shows that NEAR's futures’ Open Interest (OI) at exchanges is also increasing. The OI indicates the total number of outstanding derivative contracts that have not been settled (offset by delivery) and whether money flows into the contract are increasing or decreasing.
Increasing OI represents new or additional money entering the market and new buying, which suggests a bullish trend. On the contrary, when OI decreases, it is usually a sign that the market is liquidating, more investors are leaving, and prices may decrease.
The graph below shows that NEAR’s OI increased from $176.77 million on Friday to $266.88 million on Tuesday, the highest level since June 7. This rise indicates that new or additional money is entering the market and new buying is occurring.
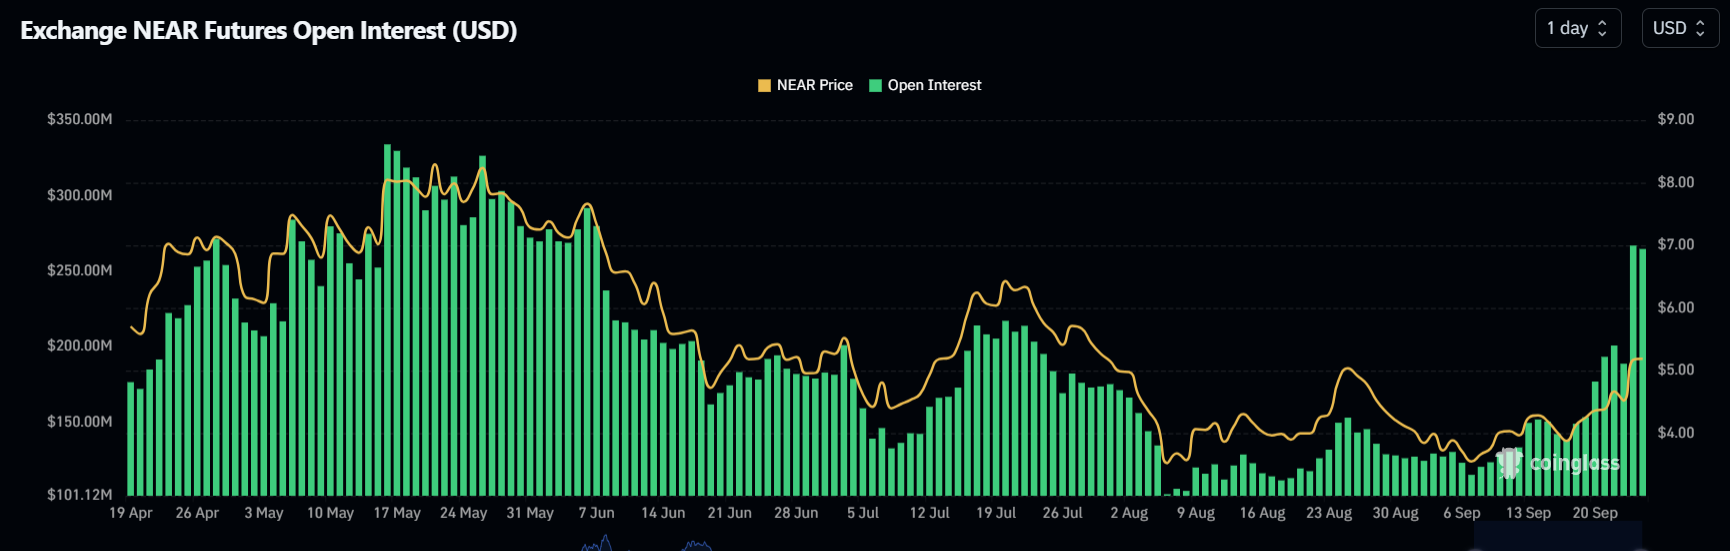
NEAR Open Interest chart
Crypto intelligence tracker DefiLlama also aligns with the bullish perspective. Data shows that NEAR's TVL increased from $199.28 million on September 18 to $244.42 million on Tuesday, the highest since the end of July.
This 23% increase in TVL indicates growing activity and interest within the NEAR Protocol ecosystem. It suggests that more users deposit or utilize assets within NEAR-based protocols.
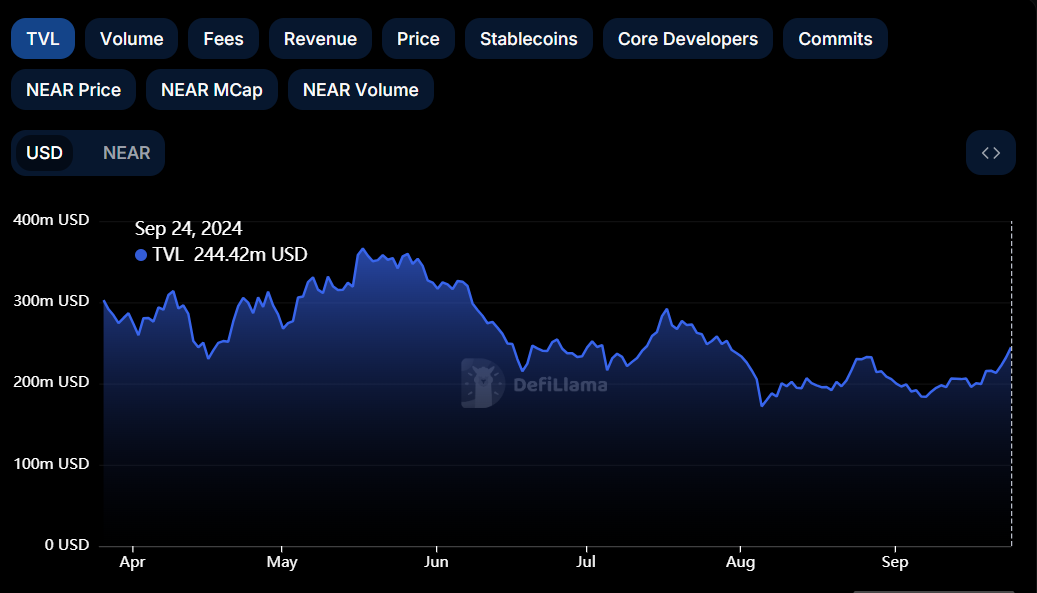
NEAR TVL chart
Even though on-chain metrics and technical analysis support the bullish outlook, if NEAR Protocol makes a daily candlestick close below $4.256, the bullish thesis would be invalidated by creating a lower low on the daily chart. This development could see NEAR’s price decline by an additional 10% to retest its September 17 low of $3.832.
Related Articles
SEC Lawsuit Concluded! What's Next for Ripple? Is Now the Right Time to Buy XRP?
This article analyzes Ripple's fundamentals, the lawsuit's outcome, future prospects, and whether now is a right time to invest in XRP.
What Is a Cryptocurrency Strategic Reserve? Why Is the U.S. Leading the Charge? Will Other Countries Follow?
This article delves into the meaning, value, risks, and future trends of cryptocurrency strategic reserves, helping you better understand the potential impact and opportunities in this emerging field.
Telegram Founder Pavel Durov Regains Freedom: Can Toncoin (TON) Experience a Breakout?
This article explores the potential impact of Pavel Durov's regained freedom on Toncoin (TON), analyzing its technical advantages, market performance, ecosystem development, and the possibility of a future breakout.
Meme token activity shifts to BNB Chain and PancakeSwap
The influence of Changpeng 'CZ' Zhao drives the BNB Chain adoption as Solana's activity slows down.
Why Was Solana Chosen for the U.S. Cryptocurrency Strategic Reserve? What Is SOL's Future Outlook?
This article explores Solana's technical strengths, use cases, market performance, and future trends to provide a comprehensive understand SOL's potential and investment opportunities.