

Silver Price Forecast: XAG/USD plummets to near $33 as US Dollar strengthens

- Silver price is down almost 1.5% as the US Dollar gains sharply.
- The Fed is not in a hurry to cut interest rates as officials seek clarity on US President Trump’s policies.
- Donald Trump is poised to announce detailed reciprocal tariffs on April 2.
Silver price (XAG/USD) plunges to near $33.10 during European trading hours on Thursday. The white metal weakens as the US Dollar (USD) gains sharply, with the US Dollar Index (DXY) climbing to near 104.00. The appeal of the US Dollar increases as the Federal Reserve (Fed) has expressed that it is no rush to cut interest rates soon amid “unusually elevated” uncertainty over the United States (US) economic outlook due to President Donald Trump’s economic policies.
Fed Chair Jerome Powell said in the press conference after the central bank left interest rates unchanged in the range of 4.25%-4.50% that Trump’s tariff policies tend to bring “growth down and inflation up”. The Fed also maintained its forecast of two interest rate cuts this year.
Technically, precious metals perform strongly in a high-inflation and low-growth environment, but higher interest rates by the Fed bode poorly for non-yielding assets, such as Silver.
The Fed has revised core Personal Consumption Expenditure Price Index (PCE) for this year higher to 2.8% from 2.5% projected in the December meeting. The central bank has also revised GDP growth for this year lower to 1.7% from their previous forecast of 2.1%.
On the geopolitical front, investors seek fresh cues on Trump’s tariff policies. Trump has been reiterating that he will introduce reciprocal tariffs on April 2, means equal tariffs for same products. Such a scenario would prompt economic uncertainty across the globe. Historically, the appeal of precious metals increases in heightened global uncertainty.
Silver technical analysis
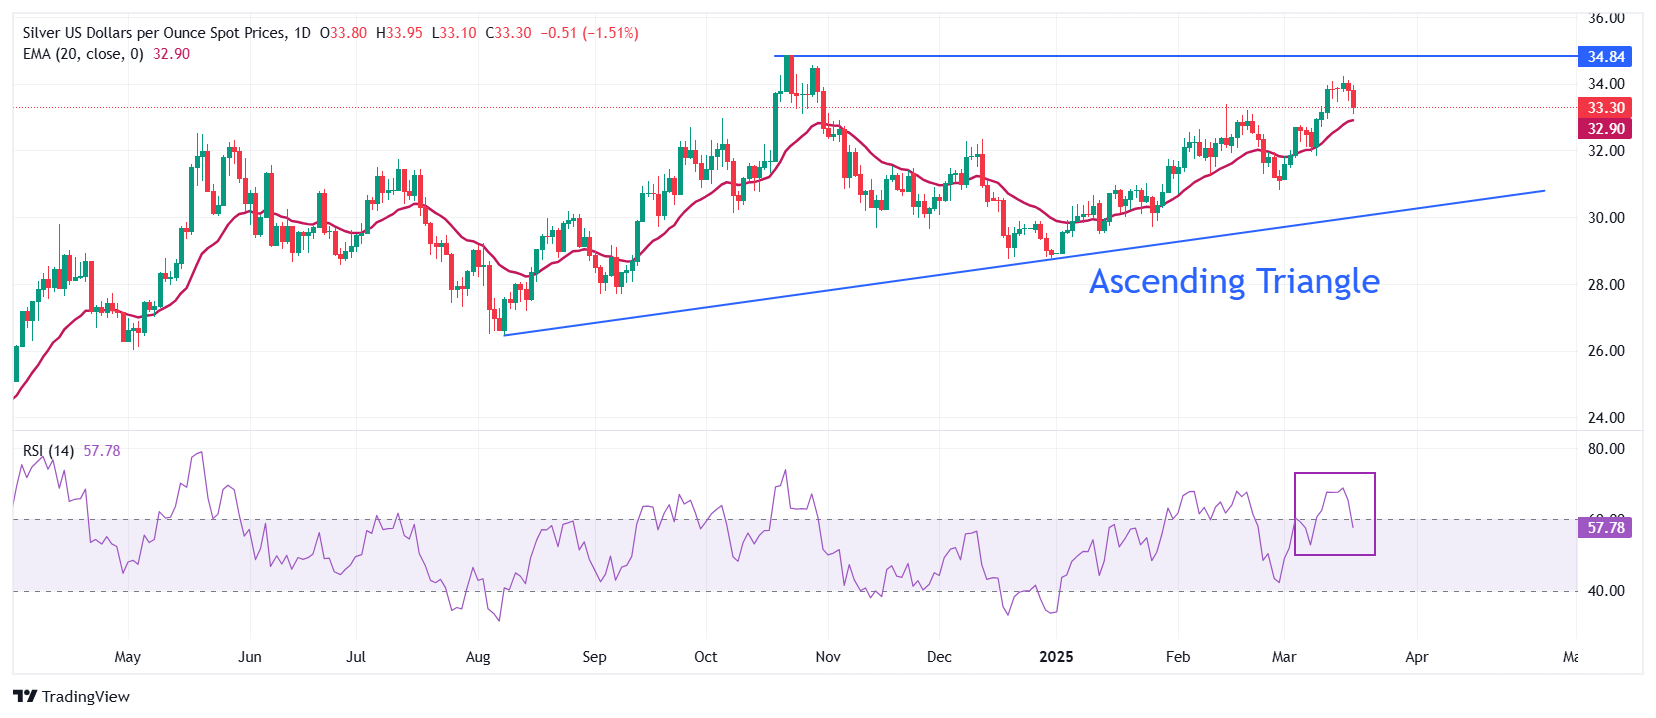
Silver price struggles to revisit the flat border of the Ascending Triangle chart pattern formation on the daily timeframe near the October 22 high of $34.87. The upward-sloping border of the above-mentioned chart pattern is placed from the August 8 low of $26.45. Technically, the Ascending Triangle pattern indicates indecisiveness among market participants.
Advancing 20-day Exponential Moving Average (EMA) near $32.901 indicates that the uptrend is intact.
The 14-day Relative Strength Index (RSI) falls below 60.00, suggesting that the bullish momentum has come to an end. However, the bullish bias is still intact.
Looking down, the March 6 high of $32.77 will act as key support for the Silver price. While, the October 22 high of $34.87 will be the major barrier.
Silver daily chart
Silver FAQs
Silver is a precious metal highly traded among investors. It has been historically used as a store of value and a medium of exchange. Although less popular than Gold, traders may turn to Silver to diversify their investment portfolio, for its intrinsic value or as a potential hedge during high-inflation periods. Investors can buy physical Silver, in coins or in bars, or trade it through vehicles such as Exchange Traded Funds, which track its price on international markets.
Silver prices can move due to a wide range of factors. Geopolitical instability or fears of a deep recession can make Silver price escalate due to its safe-haven status, although to a lesser extent than Gold's. As a yieldless asset, Silver tends to rise with lower interest rates. Its moves also depend on how the US Dollar (USD) behaves as the asset is priced in dollars (XAG/USD). A strong Dollar tends to keep the price of Silver at bay, whereas a weaker Dollar is likely to propel prices up. Other factors such as investment demand, mining supply – Silver is much more abundant than Gold – and recycling rates can also affect prices.
Silver is widely used in industry, particularly in sectors such as electronics or solar energy, as it has one of the highest electric conductivity of all metals – more than Copper and Gold. A surge in demand can increase prices, while a decline tends to lower them. Dynamics in the US, Chinese and Indian economies can also contribute to price swings: for the US and particularly China, their big industrial sectors use Silver in various processes; in India, consumers’ demand for the precious metal for jewellery also plays a key role in setting prices.
Silver prices tend to follow Gold's moves. When Gold prices rise, Silver typically follows suit, as their status as safe-haven assets is similar. The Gold/Silver ratio, which shows the number of ounces of Silver needed to equal the value of one ounce of Gold, may help to determine the relative valuation between both metals. Some investors may consider a high ratio as an indicator that Silver is undervalued, or Gold is overvalued. On the contrary, a low ratio might suggest that Gold is undervalued relative to Silver.
Related Articles
$660B Capex Bill Triggers $900B Wipeout: Why Apple Shares Outperform Amazon and Google Despite AI Lag
Based on financial disclosures, the combined 2026 capital expenditure forecasts for Meta, Amazon, Google, and Microsoft are projected to reach $660 billion. This figure is not only significantly higher than the $410 billion forecast for 2025 and $245 billion for 2024, but even surpasses the GDP of I
Amazon Stock Predictions for 2026 to 2030: Will They Exceed Expectations and Achieve Major Long-Term Goals?
TradingKey - As we head into 2026, many investors are questioning where Amazon (AMZN) fits into the technology world.
A Crash After a Surge: Why Silver Lost 40% in a Week?
TradingKey - Spot silver (XAGUSD) prices continue to decline. Silver plunged 20% on Thursday, breaking below $71 per ounce, with the sell-off intensifying on Friday as prices fell further below $64. Compared to the all-time high set on January 29, silver prices have retraced more than 40%, wiping out nearly all gains accumulated over the previous month.
Is Bitcoin’s Four-Year Cycle Dead in 2026?
Is the Bitcoin 4-year cycle dead? After 2025 broke historical records with a red post-halving year, institutional analysts explore if the Bitcoin price has decoupled from the halving countdown. Analyze the impact of spot ETFs, global liquidity, and the roadmap to the 2028 halving in this 2026 market

