Indonesia: Buy the Stocks and Hedge the Currency


Executive Summary

1. Background
1.1 1959-1965: The Guided Economy Period
After Indonesia's independence in 1949, the country faced a weak economic foundation and low per capita income, with businesses and labour still partially under Dutch control. In 1957, Sukarno initiated the nationalization of foreign enterprises. In 1959, he implemented "The Guided Economy", establishing an eight-year plan aimed at achieving self-sufficiency in basic goods as the economic goal. However, due to a lack of policy experience, a sharp increase in military expenditures and corruption, inflation surged to 1,136% in 1966 (Figure 1.1). The closed economic policy led to a decline in foreign investment, stagnation of businesses and worsening poverty.
Figure 1.1: Indonesia GDP growth and CPI in the Guided Economy Period (%)
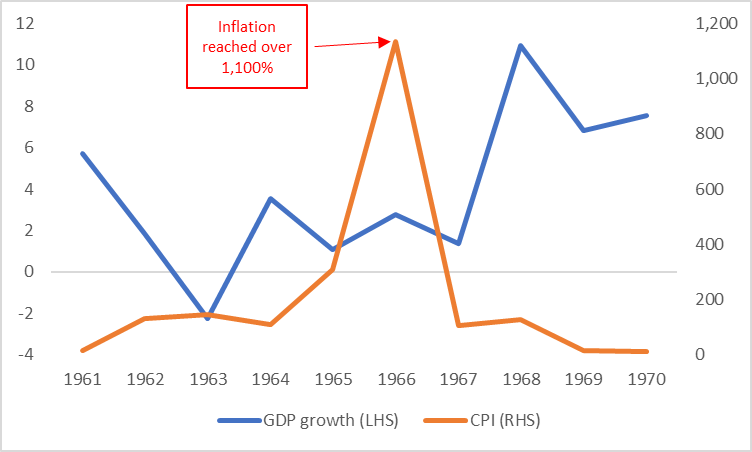
Source: World Bank, Tradingkey.com
1.2 1965-1997: The New Order Period
In 1967, Suharto came to power and adjusted economic policies to attract foreign investment and promote the development of the manufacturing sector. The "Foreign Capital Investment Law" was introduced, offering preferential policies to attract foreign capital and promoting oil joint ventures and international aid. After the 1970s, the government gradually protected domestic capital by restricting foreign investment in key sectors and fostering the development of the capital market. Starting from the 1980s, Indonesia adjusted its export structure, focusing on non-oil industries and high-value-added products to optimize the economic structure and respond to international economic fluctuations.
1.3 1997-1998: The Asian Financial Crisis Period
After over two decades of economic development, the 1997 Asian financial crisis caused a sharp depreciation in the Indonesian rupiah and the inflation rate soared to 58.5% in 1998 (Figure 1.3.1). GDP contracted by 13.1% and the poverty rate rose to 69.1% (Figure 1.3.2). The economic collapse triggered widespread unrest, leading to Suharto's resignation. The government sought assistance from the IMF and implemented policy adjustments to stabilize the economy, gradually paving the way for recovery.
Figure 1.3.1: USD/IDR during the Asian financial crisis
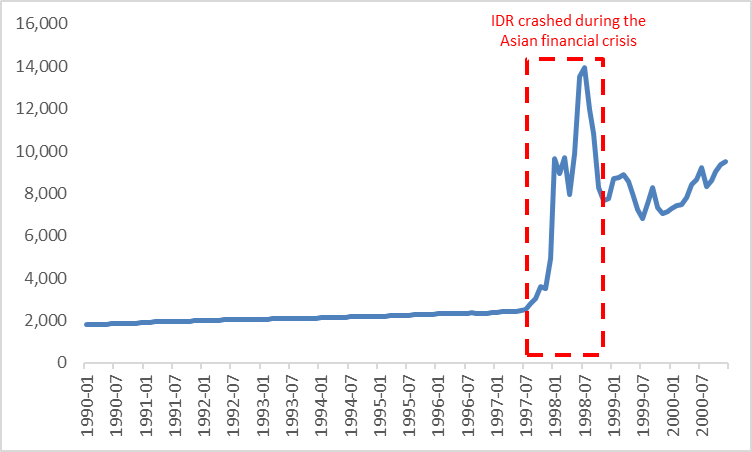
Source: OECD, Tradingkey.com
Figure 1.3.2: Indonesia GDP growth and CPI during the Asian financial crisis (%)
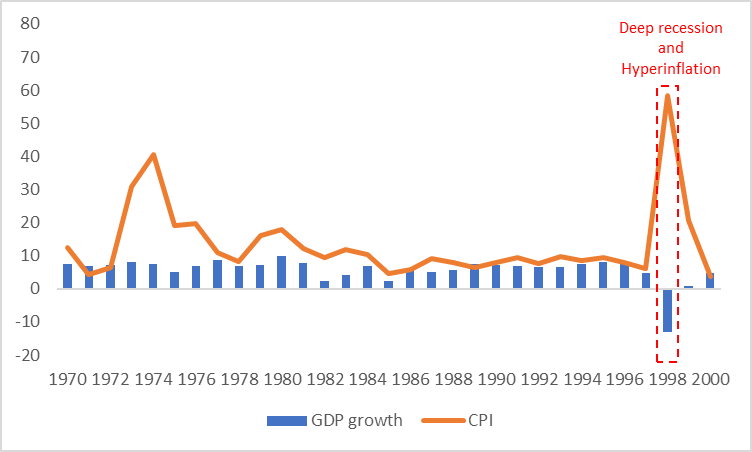
Source: World Bank, Tradingkey.com
1.4 1999-2014: The Reconstruction and Reform Period
In 1998, the Indonesian Bank Restructuring Agency (IBRA) was established to overhaul the banking sector and promote privatization. The government adjusted economic goals to reduce inflation and attract foreign investment. During Susilo Bambang Yudhoyono's presidency, medium- and long-term development plans were launched and multiple trade agreements were signed to foster industrial upgrading and economic recovery. During the period, GDP growth averaged 5.1%, inflation declined and the economy gradually stabilized (Figure 1.4).
Figure 1.4: Indonesia GDP growth and CPI in the Reconstruction and Reform Period (%)
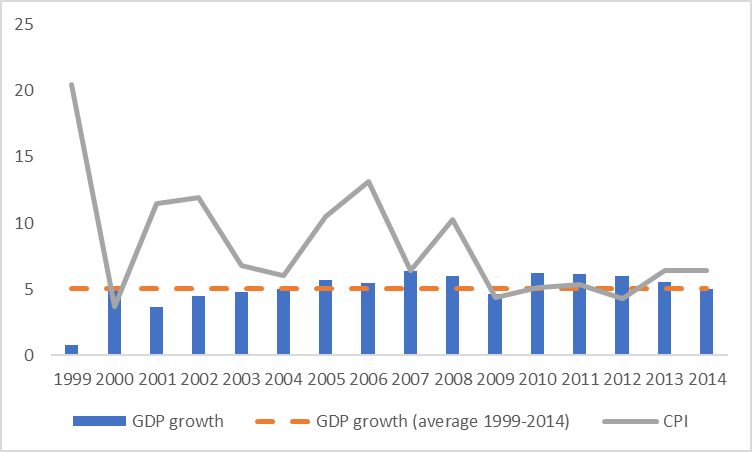
Source: World Bank, Tradingkey.com
1.5 After 2014: The Steady Development Period
In 2014, Joko Widodo took office and proposed the "Global Maritime Axis" strategy, aiming to revitalize the maritime economy and attract foreign investment. By 2023, the inward foreign direct investment (FDI) stock reached US$285.7 billion (Figure 1.5.1). In 2018, the "Industrialization 4.0" plan was launched, focusing on the development of five major areas: food and beverage, electric vehicles, consumer electronics, textiles and chemicals. In 2023, the manufacturing industry contributed 18.7% to GDP. Infrastructure construction was greatly promoted and port, aviation and power facilities were significantly improved. In 2024, Indonesia's GDP was expected to reach US$1.4 trillion, ranking first in ASEAN and making it the 16th largest economy globally (Figure 1.5.2). Indonesia has been solidifying its position as a leading economic force in Southeast Asia.
Figure 1.5.1: Indonesia inward FDI stock (USD billion)
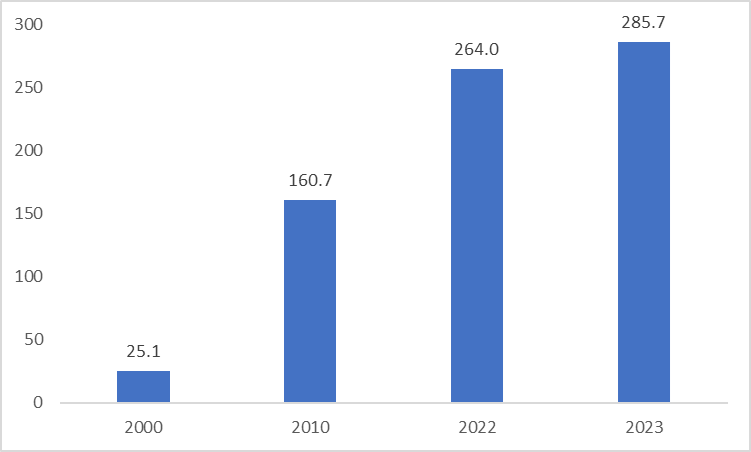
Source: Refinitiv, Tradingkey.com
Figure 1.5.2: Global GDP ranking (USD trillion)
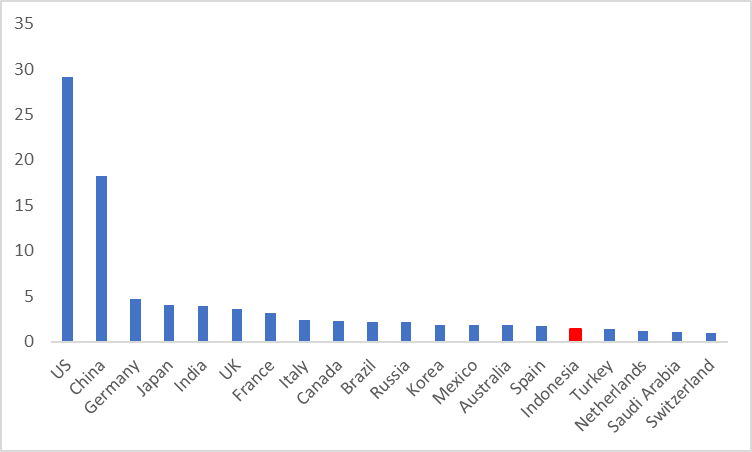
Source: IMF, Tradingkey.com
2. Recent Macroeconomics
The Indonesian economy has demonstrated signs of recovery following a slowdown in the first three quarters of 2024. The GDP growth rate in the fourth quarter of 2024 also began to rebound compared to the third quarter. This recovery is largely driven by the resurgence of the manufacturing sector, strengthened consumer confidence, a resilient labour market and a revival in business activities. More specifically, after five consecutive months of contraction, the Manufacturing PMI climbed back above the 50-threshold level in December 2024 and January 2025 (Figure 2.1). Both the Consumer Confidence Index (CCI) and the Consumer Expectations Index (CEI) have recorded positive growth for two consecutive months. The Employment Expectations Index and the Business Activity Expectations Index increased from 129 in October 2024 to above 137 by December. Furthermore, the election of new President Prabowo Subianto and the reappointment of Finance Minister Sri Mulyani have instilled fresh optimism in the economy. The new government's push for the "Down-Streaming 2.0" initiative and further infrastructure development is expected to play a pivotal role in revitalizing the Indonesian economy.
In terms of foreign trade, Indonesia has achieved a trade surplus with the US in recent years and its trade deficit with China has gradually narrowed. Although nearly half of exports are still related to commodities, signs of export diversification have begun to emerge. The proportion of exports such as automobiles, apparel, footwear, electrical machinery and furniture is increasing. Against the backdrop of rising global trade protectionism, the diversification of export products is particularly crucial. Additionally, Indonesia is likely to benefit from global supply chain restructuring.
Regarding monetary policy decisions, there are both positive and negative factors. A positive factor is the decline in food prices for several consecutive months due to improvements in food supply, which caused Indonesia's CPI to drop to 0.76% in January, well below the lower bound of the inflation target of 1.5% (Figure 2.2). This may prompt Bank Indonesia (BI) to cut interest rates. On the negative side, the weakening of the Indonesian rupiah has constrained the central bank's ability to implement significant rate cuts. Taking these two factors into account, we believe that the BI may cut interest rates 2-3 times in 2025, with each cut being 25bp.
Figure 2.1: Indonesia manufacturing PMI
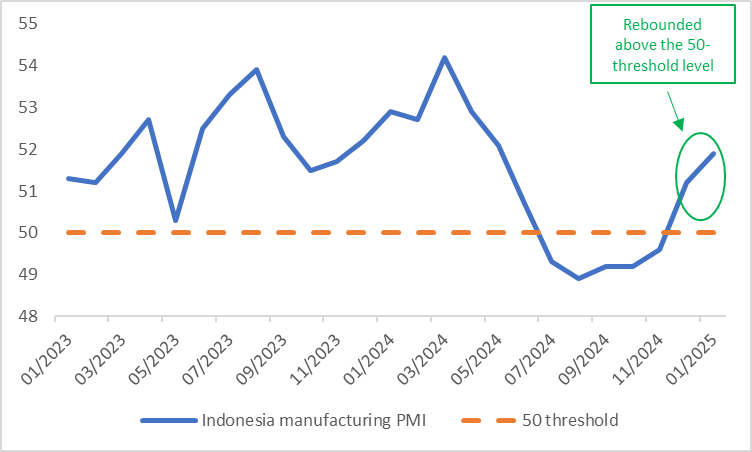
Source: Refinitiv, Tradingkey.com
Figure 2.2: Indonesia CPI (%)
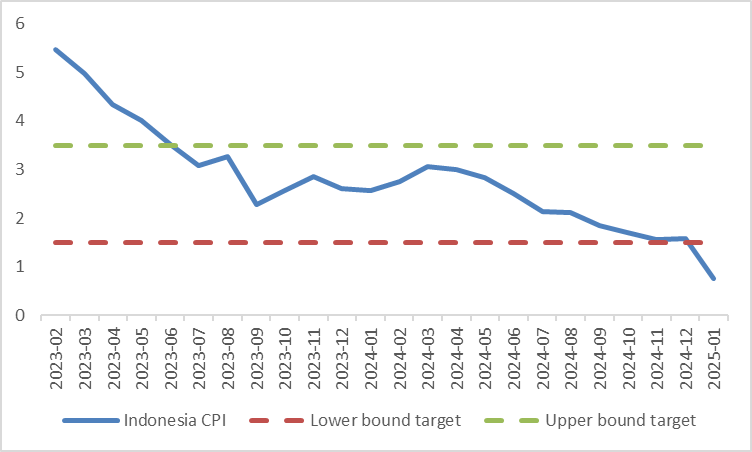
Source: Refinitiv, Tradingkey.com
3. Stocks
Since the beginning of last year, the Indonesian stock market has experienced significant volatility. This is primarily due to weak domestic demand, which resulted in minimal corporate earnings growth last year. However, looking ahead, we are bullish on Indonesian stocks for three key reasons:
First, the BI has entered a rate-cutting cycle since September last year. As of today, the central bank has only cut rates twice, totalling 50bp. This suggests that the current easing cycle has just begun. Historically, since 2005, the BI has undergone five rate-cutting cycles. During four of these cycles, the Indonesian stock market trended upward (except 2019-2021), delivering an average return of 39.6% per cycle (Figures 3.1 and 3.2). This aligns with economic principles—rate cuts provide liquidity to the economy, which is favourable for equities. Over the next 12 months, we expect the BI to continue cutting rates, potentially driving stock prices higher.
Second, with the new government's promotion of the "Down-Streaming 2.0" plan, ongoing infrastructure investments and improvements in the trade balance, Indonesia's economic growth has already reached a turning point. This will support revenue and profit growth for Indonesia-listed companies.
Third, as we anticipate a gradual decline in US Treasury yields in the medium term and the Fed remains in a rate-cutting cycle (albeit with a slower pace than expected), more foreign capital may flow into the Indonesian stock market. Additionally, with Indonesian equity valuations significantly below historical averages, this provides a strong tailwind for the market's upward momentum.
It is worth noting that the depreciation of the Indonesian rupiah may partially offset the returns from the stock market. Therefore, we recommend that overseas investors consider purchasing currency-hedged equity funds.
Figure 3.1: Bank Indonesia policy rate cuts vs. Indonesian stocks

Source: Refinitiv, Tradingkey.com
Figure 3.2: Bank Indonesia policy rate cuts vs. Indonesian stocks (chart)
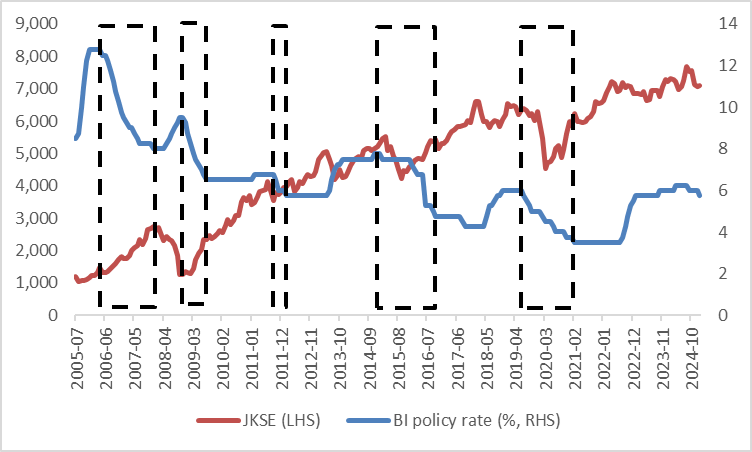
Source: Refinitiv, Tradingkey.com
4. Bonds
Similar to analysing the stock market, we examine the historical rate-cutting cycles to study the yield trends of Indonesian government bonds. In the aforementioned five rate-cutting cycles, the yield on Indonesia's 10-year government bonds declined in all instances (Figures 4.1 and 4.2). It is anticipated that the current rate-cutting cycle will also exert downward pressure on bond yields, driving their prices higher.
On the other hand, the loan-to-deposit ratio of Indonesian banks rose by 4 percentage points last year, reducing idle funds and thereby decreasing the financial sector's demand for government bonds. The lacklustre auction demand in January this year has served as evidence of this trend. Additionally, there is evidence that the pace of bond purchases by the BI slowed in January. These factors are putting pressure on bond prices, leading to rising yields.
With these opposing forces offsetting each other, we believe that the Indonesian government bond market will enter a choppy phase.
Figure 4.1: Bank Indonesia policy rate cuts vs. 10Y Indonesian government bond yield

Source: Refinitiv, Tradingkey.com
Figure 4.2: Bank Indonesia policy rate cuts vs. 10Y Indonesian government bond yield (Chart)
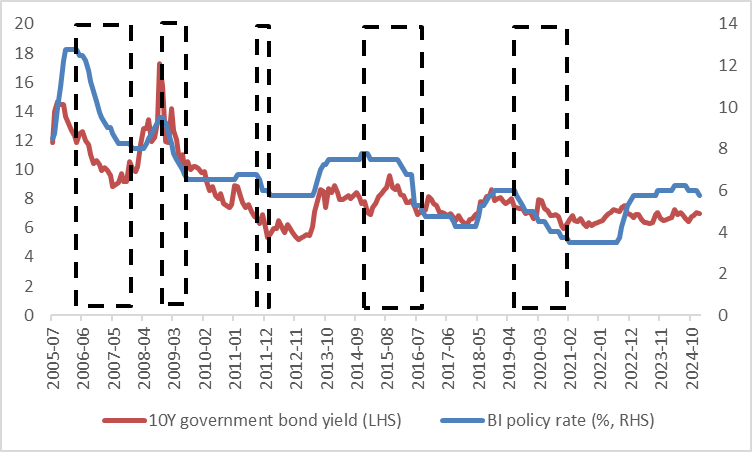
Source: Refinitiv, Tradingkey.com
5. Exchange Rate
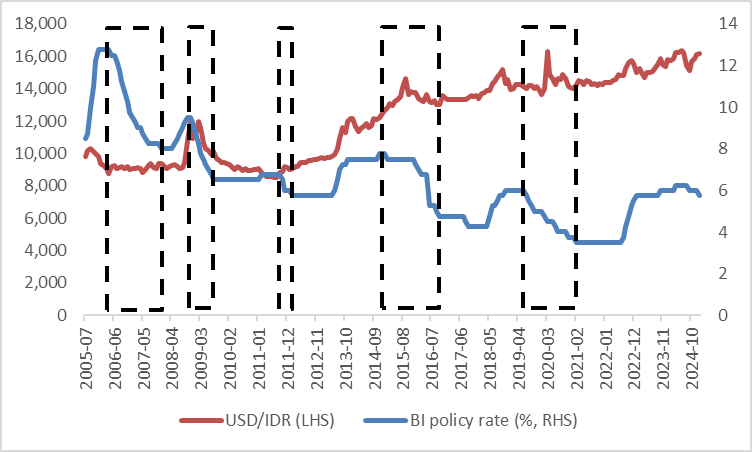
In the past five interest rate-cutting cycles, except for the period from November 2008 to August 2009, the Indonesian rupiah weakened against the US Dollar in the other four instances (Figures 5.1 and 5.2). The only exception occurred because, following the Global Financial Crisis, the safe-haven status of the US Dollar faded, leading to the strengthening of non-US currencies. Historically, the high correlation between the Indonesian rupiah and the policy rates of Bank Indonesia (BI), combined with the expected continued widening of the interest rate differential between the US and Indonesia, leads us to predict that the Indonesian rupiah will follow the current trend and continue to weaken against the US Dollar in the short term (0-3 months). However, as we anticipate the USD Index will peak and then decline in the medium term (3-12 months), the Indonesian rupiah is expected to enter a period of stability against the US Dollar during that period.
Figure 5.1: Bank Indonesia policy rate cuts vs. USD/IDR

Source: Refinitiv, Tradingkey.com
Figure 5.2: Bank Indonesia policy rate cuts vs. USD/IDR (Chart)
Source: Refinitiv, Tradingkey.com