GBP/USD backslid after UK and US CPI inflation both fell below expectations

- GBP/USD snapped a four-day gain streak after pulling back on Wednesday.
- The pair fail back below 1.2850 after CPI inflation eased lower on both continents.
- UK GDP growth, US Retail Sales slated for Thursday.
GBP/USD pulled back and declined below 1.28500 on Wednesday after Consumer Price Index (CPI) inflation eased lower on both sides of the Atlantic. Cable has snapped a four-day win streak, and heads into the back half of the trading week on the backfoot with UK Gross Domestic Product (GDP) growth figures and US Retail Sales on the docket.
Forex Today: Soft or hard landing? Upcoming US data will have a say
UK QoQ GDP growth is expected to tick down to 0.6% from the previous 0.7%, while annualized UK GDP is expected to rebound to 0.9% from the previous 0.3%. On the US side, MoM Retail Sales are expected to rebound to 0.3% after a flat 0.0% in June.
The US CPI inflation rate came in at 2.9% YoY in July, slightly below the anticipated 3.0%. Core CPI inflation also decreased to 3.2% annually, from the previous 3.0%. Both headline and core monthly CPI figures rose by 0.2% MoM in July, exceeding the rates of 0.15% and 0.17% for headline and core CPI, respectively.
Despite the drop in consumer-level inflation, investors had expected even lower figures following this week's US Producer Price Index (PPI) inflation, which revealed more significant drops in producer-level price pressures. However, it appears that the decline in price pressures is not being directly transferred to consumers. According to the CME's FedWatch Tool, rate markets are now pricing in only a 40% chance of a double-cut from the Federal Reserve (Fed) on September 18, down from 50% earlier this week and 70% the previous week.
UK CPI rose YoY in July, but failed to meet median market forecasts, printing at 2.2% versus the expected 2.3%. The figure is still higher than the previous 2.0%, while core CPI inflation figures eased to 3.3% from the previous 3.5%.
GBP/USD price forecast
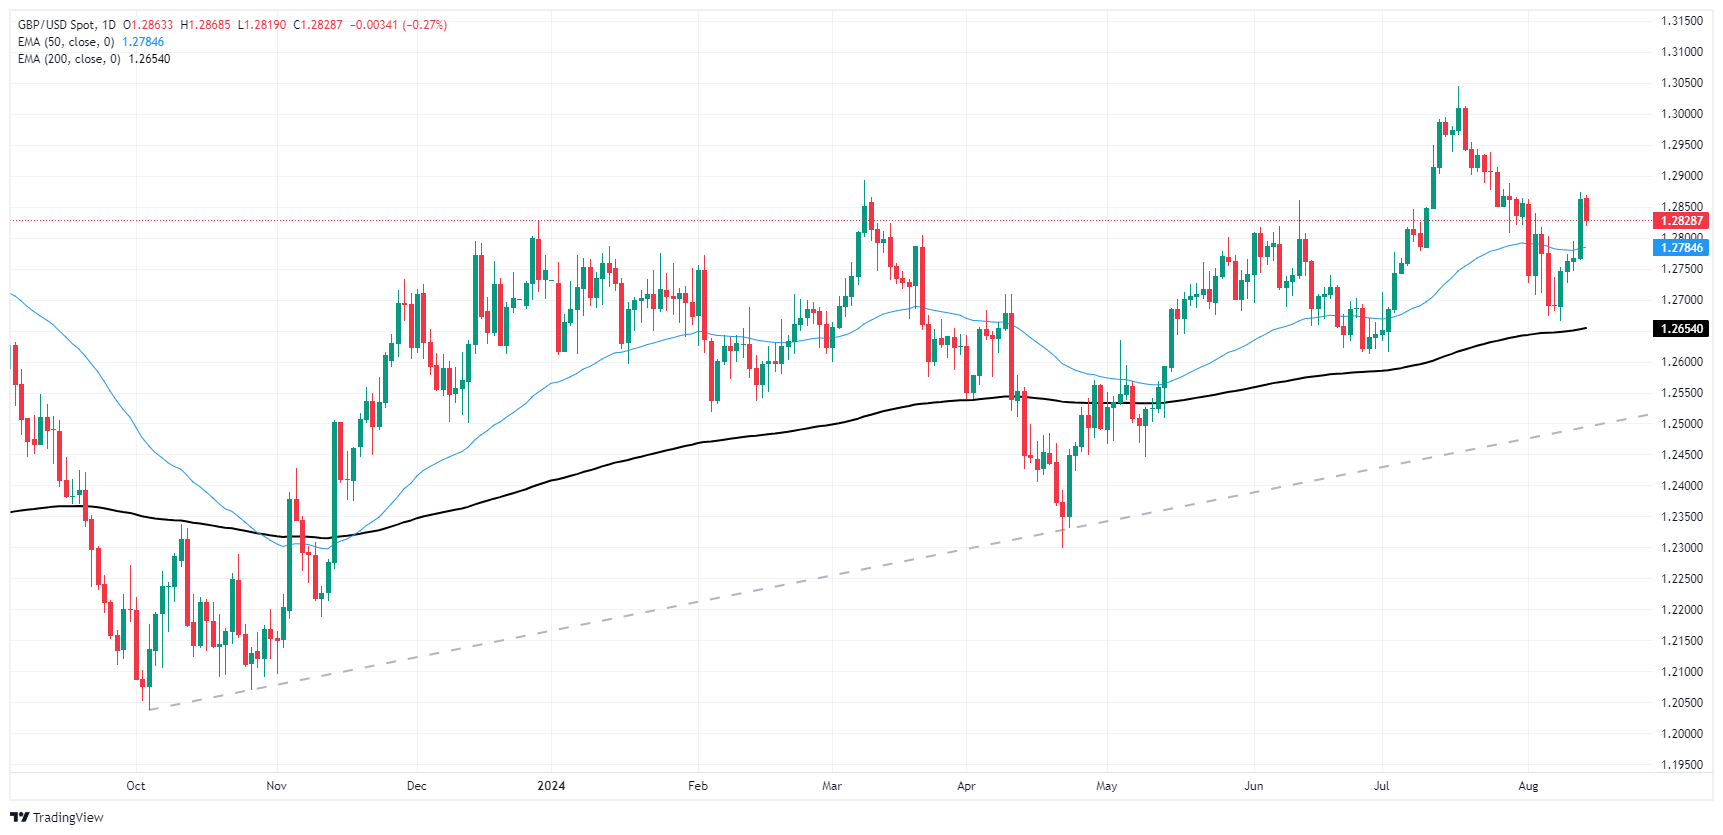
GBP/USD has ended a four-day recovery rally after a technical bounce from the 200-day Exponential Moving Average (EMA) last week near 1.2675. Bulls remain in control of the technical charts, but Cable has yet to pierce and recover the 1.2900 handle that was lost in mid-July.
The long-term trend favors bidders as weakness in the Greenback sends the Pound Sterling higher, and a long-run technical pattern of higher lows is keeping bullish momentum on the high side.
GBP/USD daily chart


