GBP/USD lurches higher but still exposed to downside

- GBP/USD caught a bounce from the 200-day EMA on Thursday.
- Markets recover footing after US labor data plunge.
- Key inflation data for both the UK and US due next week.
GBP/USD found a step higher on Thursday, climbing roughly half of a percent as market sentiment continues to spool back up after a three-day plunge that kicked off in earnest late last week following a misprint in US Nonfarm Payrolls (NFP) figures.
Forex Today: Market turbulence dissipates
Friday will close out the trading week with a thin economic calendar on both sides of the Atlantic, and markets will be gearing up for fresh updates on inflation in both the UK and the US. The Pound Sterling took a beating after a recent quarter-point rate cut from the Bank of England (BoE), and markets are on the lookout for signs of further UK rate cuts and an initial rate trim from the US Federal Reserve (Fed) expected in Semtember.
US Initial Jobless Claims for the week ended August 2 printed at 233K, less than the forecast 240K and easing back from the previous week’s 250K. Cooling initial unemployment figures are helping investors keep a lid on recent downturn fears after last week’s US labor data dump sparked a firm risk-off bid.
US data watchers will be looking forward to a fresh round of producer—and consumer-level inflation figures due next week. US Producer Price Index (PPI) inflation is slated for next Tuesday, with Consumer Price Index (CPI) inflation on the books for next Wednesday. On the UK side, UK labor figures are expected on Tuesday, followed by a July update on UK CPI inflation.
GBP/USD price forecast
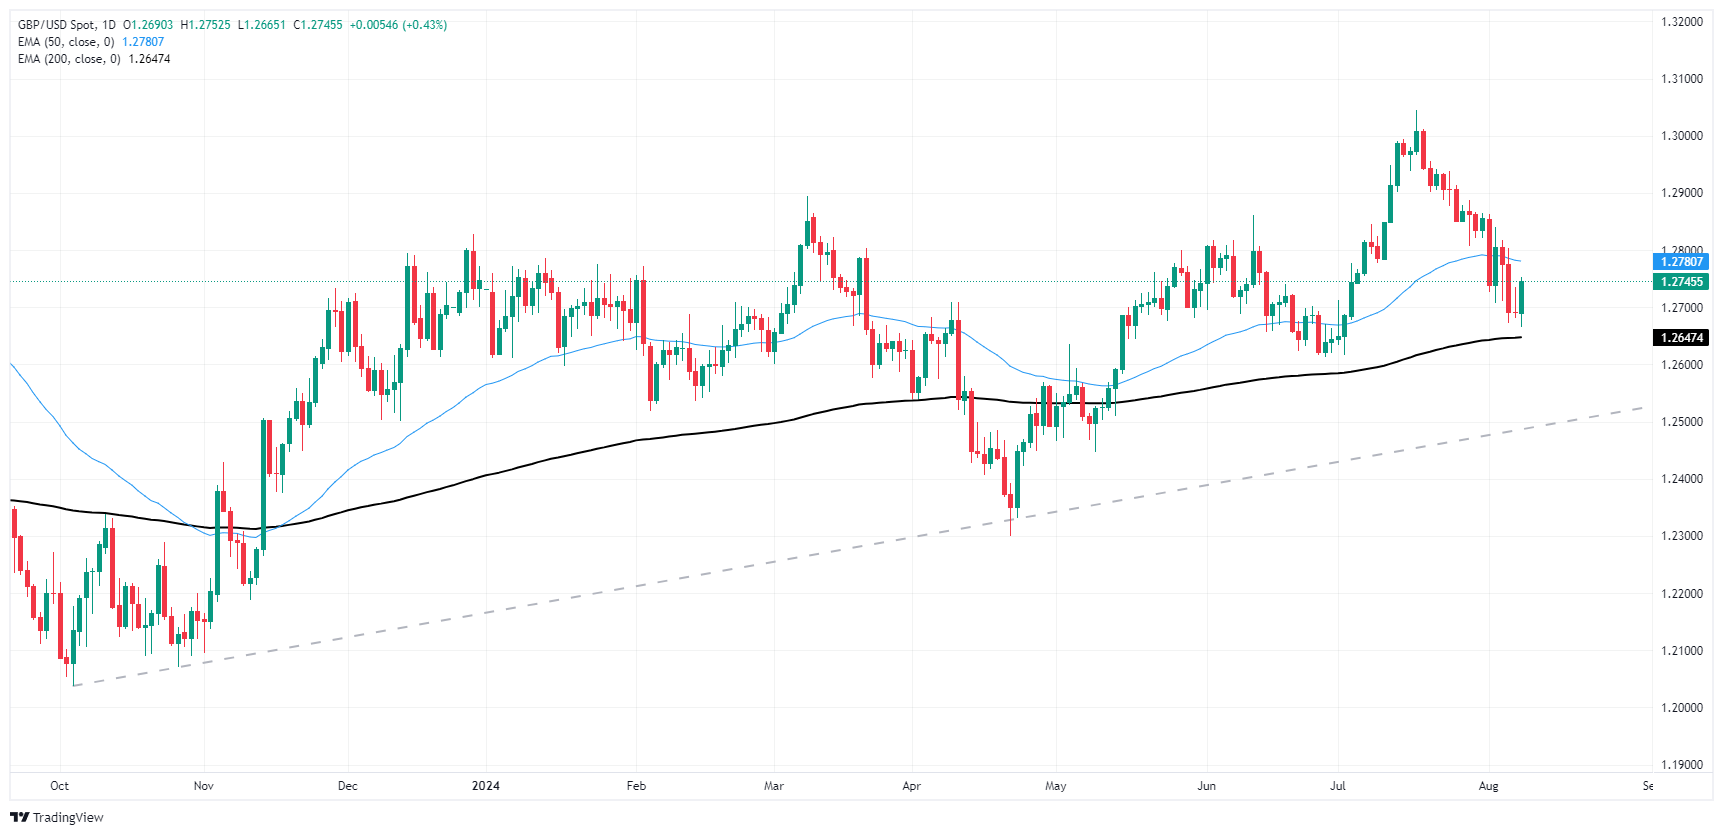
Cable’s bullish bounce on Thursday is poised to chalk in a topside run after bids pinged off the 200-day Exponential Moving Average (EMA) at 1.2672. Bidders will be looking to claw back chart paper lost in a -2.9% backslide from 12-month highs set in mid-July near 1.3050.
Bullish momentum will need to climb back over the 50-day EMA at 1.2780 with price action mired in divergence territory between the 50- and 200-day EMAs.
GBP/USD daily chart


