GBP/USD falters on uneasy market flows but holds in midrange

- GBP/USD took a tumble on Monday after risk-off flows pummeled markets.
- Despite a near-term plunge, bids continue to grind out chart paper near 1.2800.
- Souring US economic data has markets piling into Fed rate cut bets.
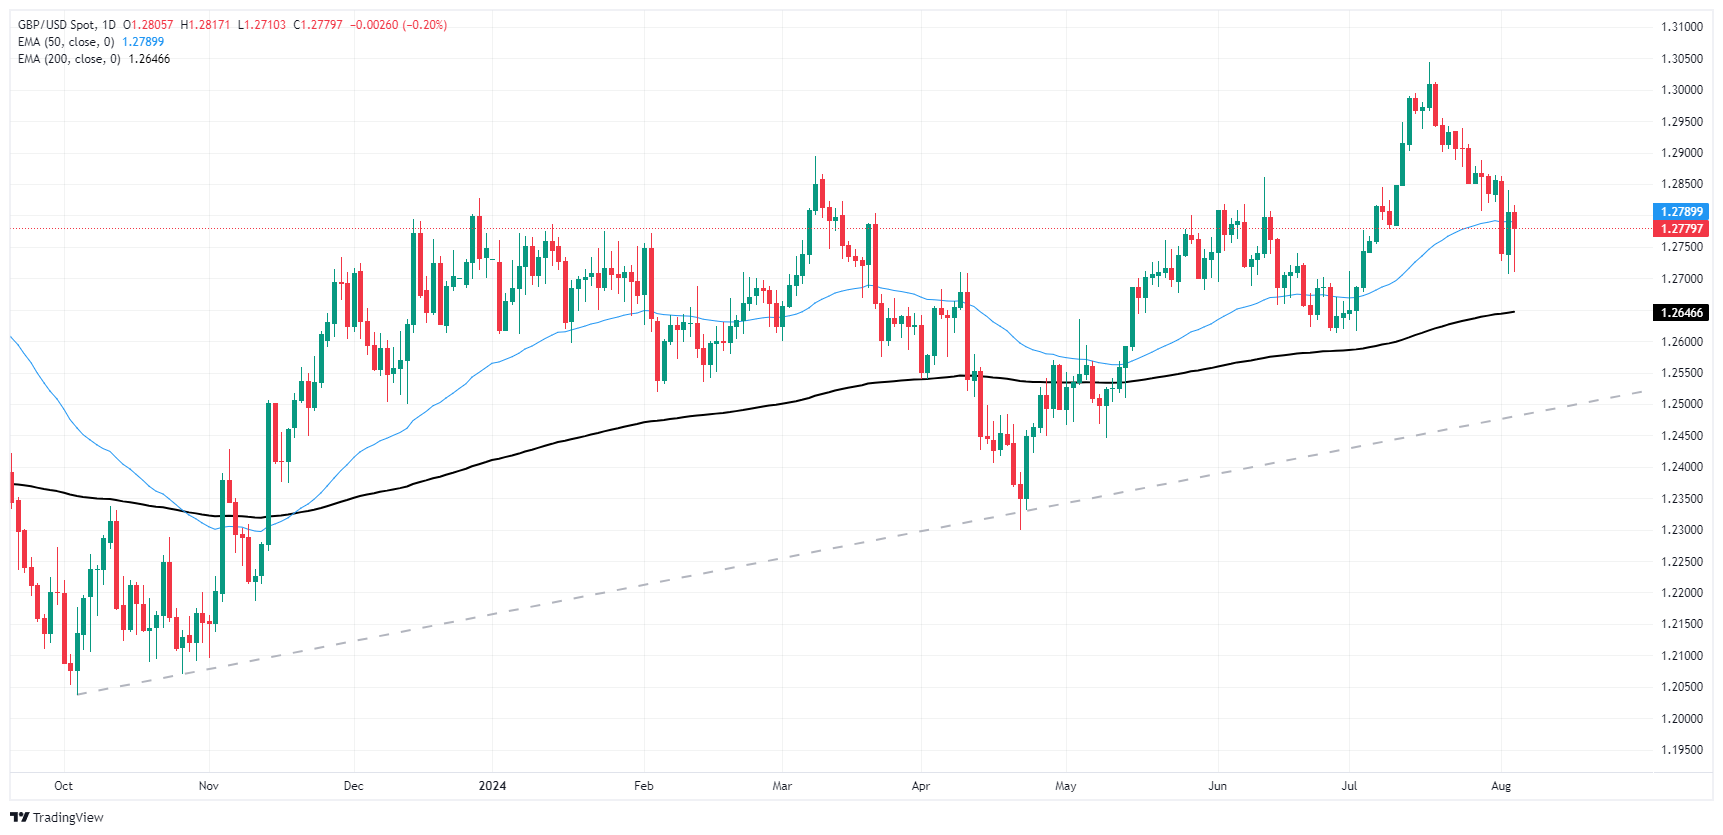
GBP/USD kicked off the new trading week with a fresh plunge on Monday, falling into familiar lows just north of 1.2700 before recovering ground to end the day close to where it started just below the 1.2800 handle. Markets reversed course and piled into the Greenback in early trading after more US data came in below expectations, hardening broad-market bets of an accelerated pace of rate cuts from the Federal Reserve (Fed) through the rest of the year.
Forex Today: Fed’s rate cut gathers pace
According to the CME’s FedWatch Tool, rate markets are pricing in nearly 85% odds of a double-cut from the Fed on September 18th for 50 basis points after US data took a turn on Friday and further mixed prints on Monday. The rest of the trading week offers a light affair on the economic data docket, giving markets some breathing room and some time to chew on current positioning.
July’s US Composite Purchasing Managers Index (PMI) printed below expectations on Monday, falling to 54.3 versus the forecast flat hold at 55.0. However, ISM Services PMI for the same period accelerated to 51.4, beating the forecast 51.0 and climbing above the previous 48.8 to settle back in expansion territory above 50.0. However, the ISM Sevices Prices Paid in July accelerated to 57.0 from 56.3, routing the market’s forecast tick down to 55.8 as business-level inflation pressures continue to simmer away.
GBP/USD technical outlook
Monday’s back-and-forth chart action has left Cable battling the 50-day Exponential Moving Average (EMA) at 1.2790, with intraday price action hobbled just south of the 1.2800 price handle. Bids continue to hold on the high end of the 200-day EMA at 1.2672, but bidders are struggling to find a foothold with GBP/USD down 2.58% peak-to-trough from July’s 12-month peak at 1.3044.
GBP/USD daily chart


