USD/JPY Price Analysis: Long-term trend at risk of reversing

- USD/JPY has fallen to key make-or-break support for the pair.
- A break below could indicate a change of the long-term trend and more downside.
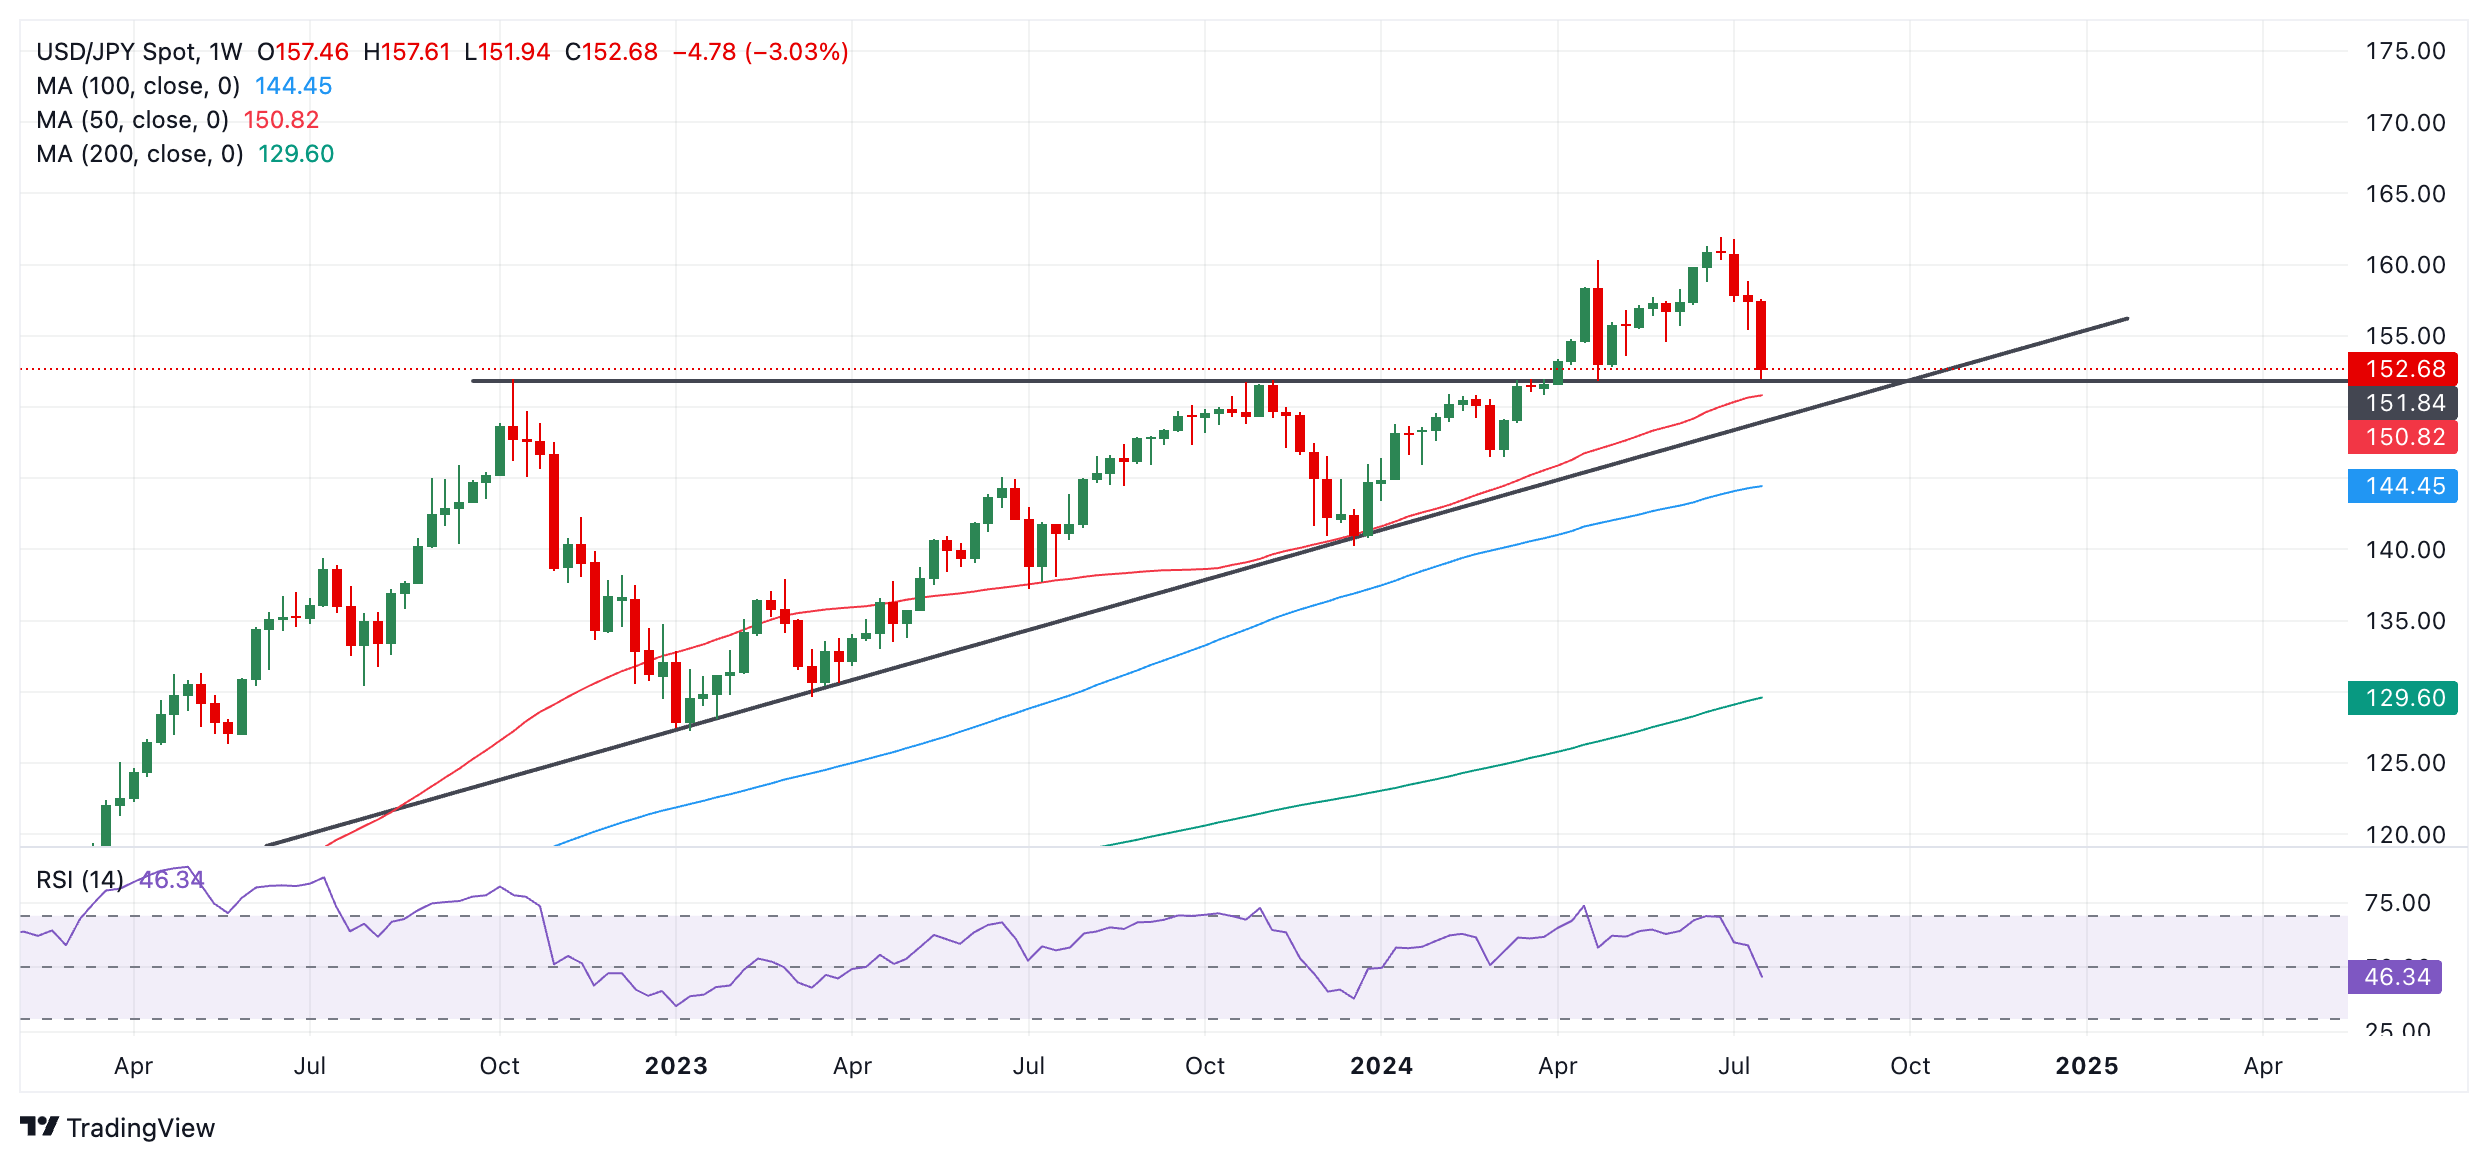
USD/JPY has weakened over the last three weeks and reached support at a key price level on the charts, roughly in the 151.80s – which coincides with the October 2022 and 2023 highs.

USD/JPY Weekly Chart
The long-term trend remains bullish suggesting the odds on balance favor a recovery, however, there are no signs yet from price action that this is the case. USD/JPY keeps going lower. In addition, if this week ends as a long red candlestick (we are already halfway through Thursday) the weekly chart will have formed an ominous Three Black Crows Japanese candlestick pattern, with bearish implications.
The current support level is very significant and represents a crossroads for price. A recovery bounce from here might indicate the longer-term uptrend was resuming. On the other hand a break below would bring the long-term uptrending bias into doubt.
Further, a break below the 50-week Simple Moving Average and a decisive break below the major trendline for the uptrend situated at roughly 149.50, would confirm a reversal in the long-term trend. Such a break would open up downside targets at roughly 141.60, followed by 136.85.
A decisive break would be one in which USD/JPY broke clearly below the trendline with a long red candlestick that closed near its low, or three red candlesticks in a row.
Price would need to form a bullish reversal pattern at the current level for confidence the longer-term uptrend was resuming. This could be a Japanese Hammer or a Two-Bar reversal, for example. This would then indicate prices might recover and retouch the 161.95 high (June 28), and perhaps even make a new higher high.


