tradingkey.logo

NZD/USD Price Analysis: Pair stuck in 0.6050-0.6070 range, bears in control

FXStreetJul 19, 2024 12:23 AM
  • NZD/USD finds difficulty in establishing above the 0.6070 level, hovering close to lows outlined in May.


  • The pair continues to trade beneath the pivotal 20, 100, and 200-day SMA lines, pointing to a neutral to bearish outlook.


  • Daily indicators maintain a bearish tilt as selling pressure persists.


During Thursday's session, the NZD/USD dropped by 0.60% to touch the 0.6050 level. The pair's struggle to remain firm above the 0.6070 mark keeps it near the lows recorded in May. Significantly, NZD/USD is still trading under the important Simple Moving Averages (SMA) of 20, 100, and 200 days, inferring a neutral to bearish perspective.


The daily technical indicators affirm the bearish stance. The Relative Strength Index (RSI) sits at 39, moving downward compared to the Wednesday session's reading of 45. Meanwhile, the Moving Average Convergence Divergence (MACD) continues to show rising red bars, indicating an escalating bearish momentum.
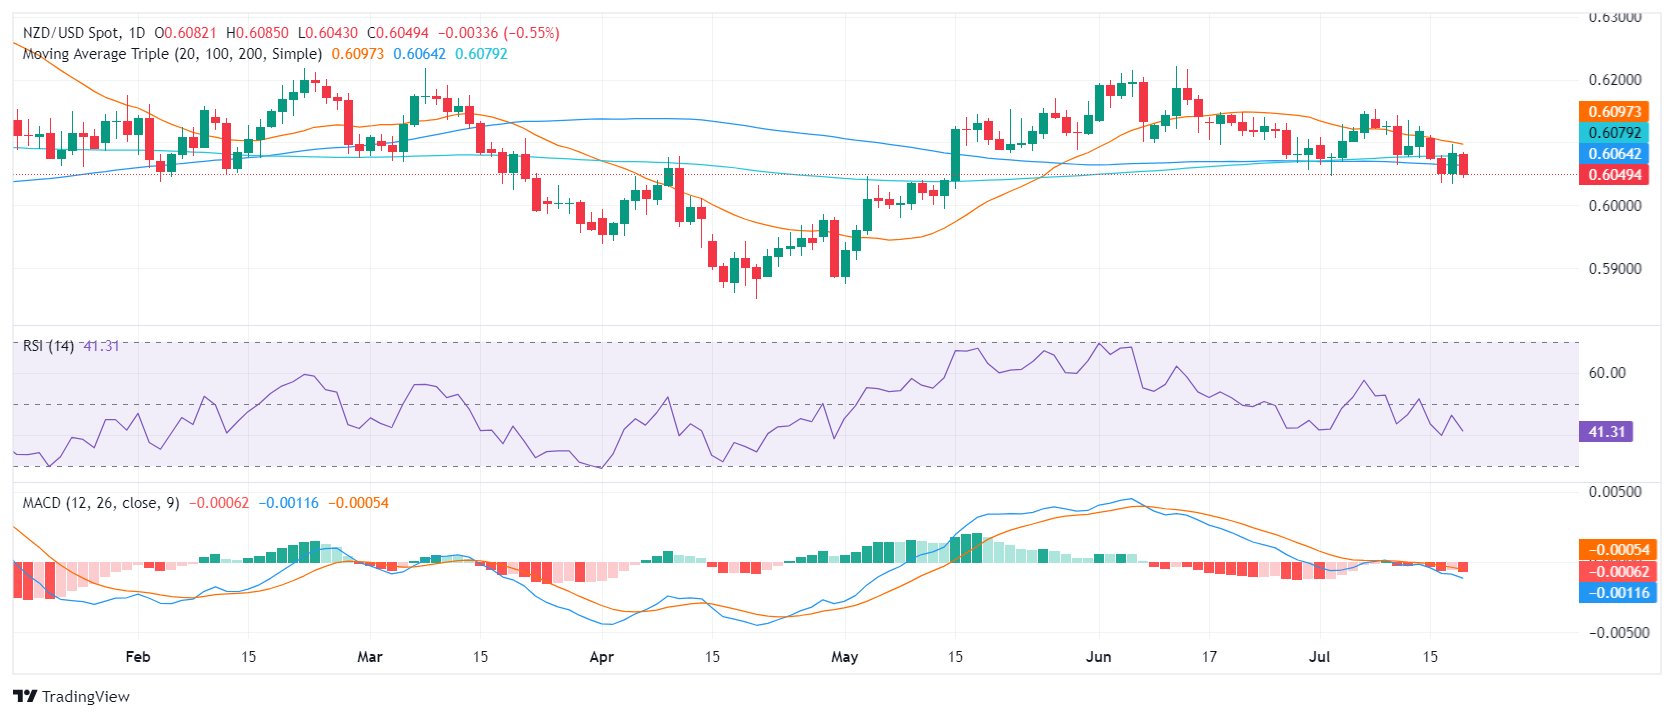


NZD/USD daily chart


Resistance is now situated at the earlier support level of 0.6070, succeeded by the 20-day SMA around the 0.6100 level, then at 0.6150 and further above at 0.6200. Bulls require a decisive closing above these points to indicate a bullish reversal, shifting the focus upward.


The downside observes robust support at 0.6050, followed by 0.6030, adjusting to the bearish tilt, a significant benchmark at 0.6000 comes into sight. An appreciable plunge beneath these levels would certify the bearish outlook, potentially leading to a correction toward lower levels.

Reviewed byTony
Disclaimer: The content of this article solely represents the author's personal opinions and does not reflect the official stance of Tradingkey. It should not be considered as investment advice. The article is intended for reference purposes only, and readers should not base any investment decisions solely on its content. Tradingkey bears no responsibility for any trading outcomes resulting from reliance on this article. Furthermore, Tradingkey cannot guarantee the accuracy of the article's content. Before making any investment decisions, it is advisable to consult an independent financial advisor to fully understand the associated risks.

Related Instruments

Recommended Articles

tradingkey.logo
tradingkey.logo
Intraday Data provided by Refinitiv and subject to terms of use. Historical and current end-of-day data provided by Refinitiv. All quotes are in local exchange time. Real-time last sale data for U.S. stock quotes reflect trades reported through Nasdaq only. Intraday data delayed at least 15 minutes or per exchange requirements.
* References, analysis, and trading strategies are provided by the third-party provider, Trading Central, and the point of view is based on the independent assessment and judgement of the analyst, without considering the investment objectives and financial situation of the investors.
Risk Warning: Our Website and Mobile App provides only general information on certain investment products. Finsights does not provide, and the provision of such information must not be construed as Finsights providing, financial advice or recommendation for any investment product.
Investment products are subject to significant investment risks, including the possible loss of the principal amount invested and may not be suitable for everyone. Past performance of investment products is not indicative of their future performance.
Finsights may allow third party advertisers or affiliates to place or deliver advertisements on our Website or Mobile App or any part thereof and may be compensated by them based on your interaction with the advertisements.
© Copyright: FINSIGHTS MEDIA PTE. LTD. All Rights Reserved.