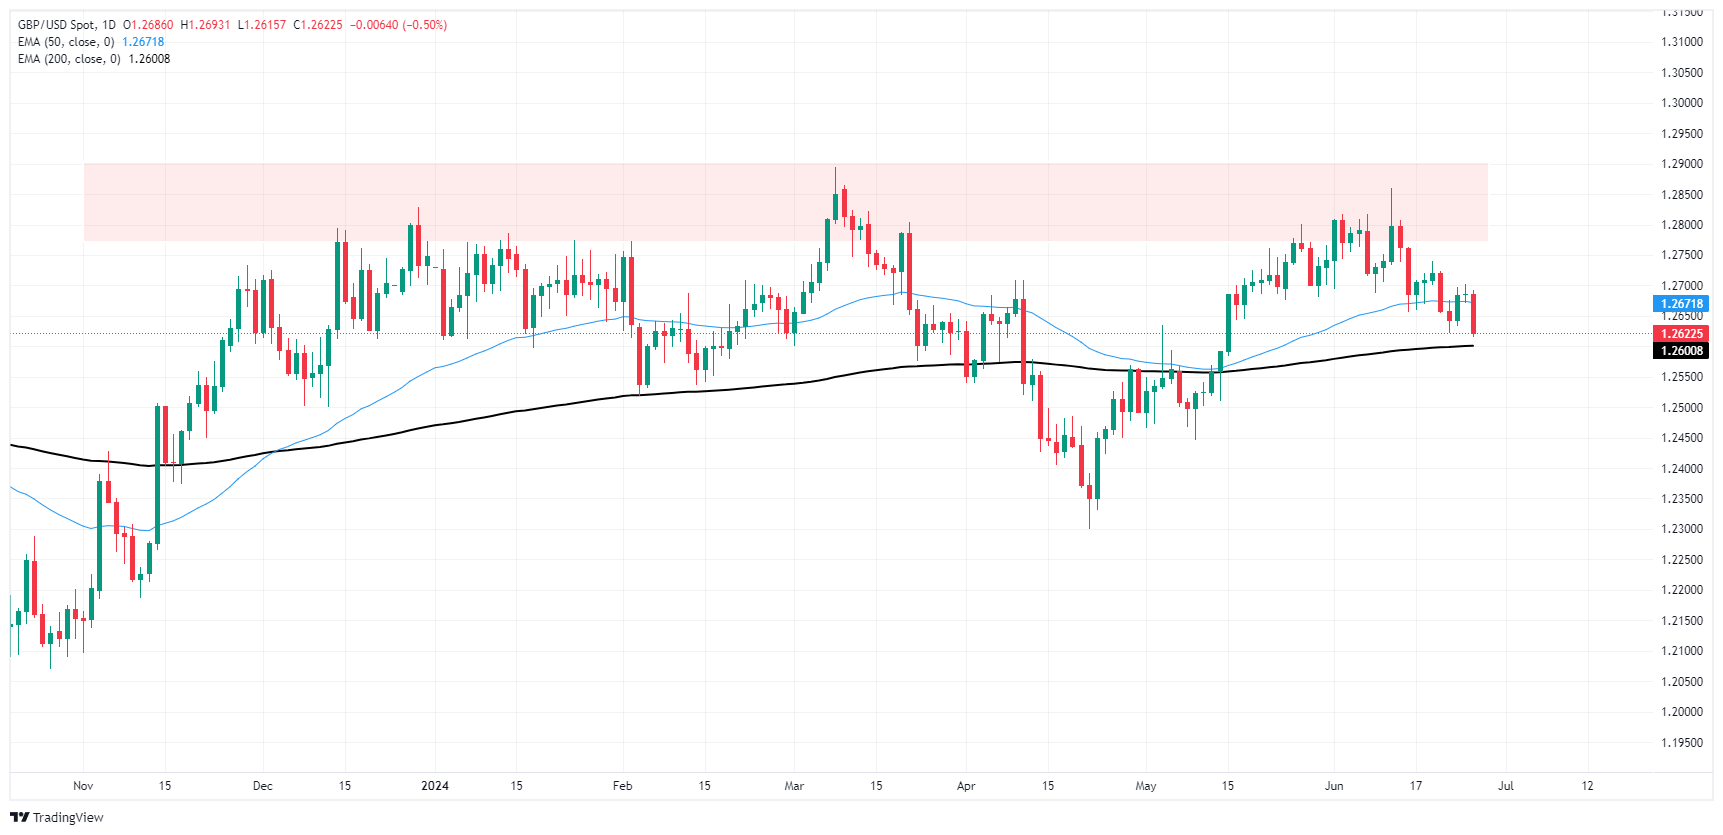
GBP/USD slumps to familiar lows in midweek action as Greenback bids reignite

- Rate cut hopes slowly bleed confidence on data-thin Wednesday.
- Risk-off market flows take a step higher, but remain subdued amid low-tier data.
- The latter half of the trading week kicks off a flurry of top-tier data releases.
GBP/USD backslid into familiar near-term lows on Wednesday as tepid market flows bolstered the US Dollar. The Pound Sterling remained pinned on the low side as the pair struggled to stay above 1.2600.
Wednesday brought little of note in scheduled releases, with the UK absent from the economic calendar and US New Home Sales Change in May clocking in a -11.3% decline MoM compared to the previous month’s 2.0%, revised sharply from the initial print of -4.7%.
Forex Today: Investors look at US PCE
Thursday kicks off a flurry of meaningful data after spending most of the early week in the doldrums. The Bank of England’s (BoE) latest Financial Stability Report will be published early during the London market session, followed by US Durable Goods Orders, revisions to first-quarter Gross Domestic Product (GDP), and weekly Initial Jobless Claims.
US QoQ is expected to tick upward slightly to 1.4% from the initial print of 1.3%, while May’s US Durable Goods Orders are expected to print a -0.1% contraction compared to the previous month’s revised 0.6%. US Initial Jobless Claims for the week ended June 21 are expected to tick slightly lower to 236K from the previous 238K, but the figure is expected to come in above the four-week average of 232.75K.
Friday will round out the trading week with the UK’s own quarterly GDP revisions, expected to hold steady at 0.6% QoQ, with May’s US Personal Consumption Expenditure Price Index (PCE) inflation. Core PCE Price Index inflation is expected to tick down YoY to 2.6% from the previous 2.8% as market participants hope for further signs of easing inflation to help push the Federal Reserve (Fed) towards rate cuts sooner rather than later.
According to the CME’s FedWatch Tool, rate market bets of a September 18 rate trim from the Federal Open Market Committee (FOMC) have slowly bled out confidence. They are approaching 60% odds of at least a quarter-point rate cut on September 18 after peaking just above 70% last week.
British Pound PRICE This week
The table below shows the percentage change of British Pound (GBP) against listed major currencies this week. British Pound was the strongest against the New Zealand Dollar.
| USD | EUR | GBP | JPY | CAD | AUD | NZD | CHF |
|---|---|---|---|---|---|---|---|---|
USD |
| 0.12% | 0.17% | 0.58% | 0.08% | -0.11% | 0.57% | 0.36% |
EUR | -0.12% |
| 0.07% | 0.53% | 0.01% | -0.20% | 0.50% | 0.32% |
GBP | -0.17% | -0.07% |
| 0.39% | -0.06% | -0.28% | 0.42% | 0.24% |
JPY | -0.58% | -0.53% | -0.39% |
| -0.49% | -0.66% | 0.04% | -0.22% |
CAD | -0.08% | -0.01% | 0.06% | 0.49% |
| -0.18% | 0.48% | 0.30% |
AUD | 0.11% | 0.20% | 0.28% | 0.66% | 0.18% |
| 0.70% | 0.52% |
NZD | -0.57% | -0.50% | -0.42% | -0.04% | -0.48% | -0.70% |
| -0.19% |
CHF | -0.36% | -0.32% | -0.24% | 0.22% | -0.30% | -0.52% | 0.19% |
|
The heat map shows percentage changes of major currencies against each other. The base currency is picked from the left column, while the quote currency is picked from the top row. For example, if you pick the British Pound from the left column and move along the horizontal line to the US Dollar, the percentage change displayed in the box will represent GBP (base)/USD (quote).
GBP/USD technical outlook
The Cable has extended a two-week backslide as the pair tumbles from the last swing high to 1.2860, shedding the 50-day Exponential Moving Average (EMA) at 1.2671 and is now within touch range of major technical support from the 200-day EMA at 1.2600.
A supply zone priced in above 1.2800 is firmly crimping bullish momentum, and an extended bearish decline will push the GBP/USD down to April’s swing low into 1.2300.
GBP/USD daily chart


