Australian Dollar extends decline following mixed China’s economic data

- The Australian Dollar weakens amid the firmer US Dollar in Monday’s Asian session.
- The hawkish tone of the Fed and challenges in China’s economic recovery weigh on AUD/USD.
- The RBA interest rate decision on Tuesday will be in the spotlight, with no change in rate expected.
The Australian Dollar (AUD) extends downside for the third consecutive day on Monday on the back of the stronger US Dollar (USD) broadly. The Greenback remains well-supported by the expectation that US interest rates will stay higher for longer, with the median projection from Federal Reserve (Fed) officials calling for one interest rate cut this year.
Furthermore, the latest mixed Chinese economic data and some challenges in China's economic operations might exert some selling pressure on the Aussie as China accounts for one-third of Australian exports. Investors will closely watch the Reserve Bank of Australia (RBA) interest rate decision on Tuesday, along with the Governor Michele Bullock press conference. The hawkish hold from the RBA could boost the AUD and cap the downside for AUD/USD in the near term. On the US docket, the Retail Sales for May will be released, which is expected to improve to 0.3% from 0% in April.
Daily Digest Market Movers: Australian Dollar attracts some sellers ahead of RBA policy meeting
- The Reserve Bank of Australia (RBA) will likely keep the cash rate at 4.35% for a fifth straight meeting as it tries to restrain consumer prices that have been underpinned by an ultra-tight employment market, economists surveyed by Bloomberg forecast.
- China’s Retail Sales improved 3.7% YoY in May from 2.3% in April, which is better than the estimate of 3.0%. Meanwhile, the nation’s Industrial Production rose 5.6% YoY in the same period, compared to the previous reading of 6.7%, below the consensus of 6.0%, the National Bureau of Statistics (NBS) showed Monday.
- The preliminary University of Michigan's Consumer Sentiment Index declined to 65.6 in June from 69.1, below the market consensus of 72.
- The UoM one-year Consumer Inflation Expectation held steady at 3.3%, while the five-year inflation outlook rose to 3.1% from 3%.
- Minneapolis Fed President Neel Kashkari said on Sunday that it is a “reasonable prediction” that the central bank will wait until December to cut interest rates. Kashkari added that the Fed is in a very good position to get more data before making any decisions.
- Cleveland Fed President Loretta Mester noted on Friday that she would like to see good-looking inflation data, adding that the path towards the Fed's 2.0% inflation goal may take longer than expected.
Technical Analysis: AUD/USD’s positive outlook remains fragile in the longer term
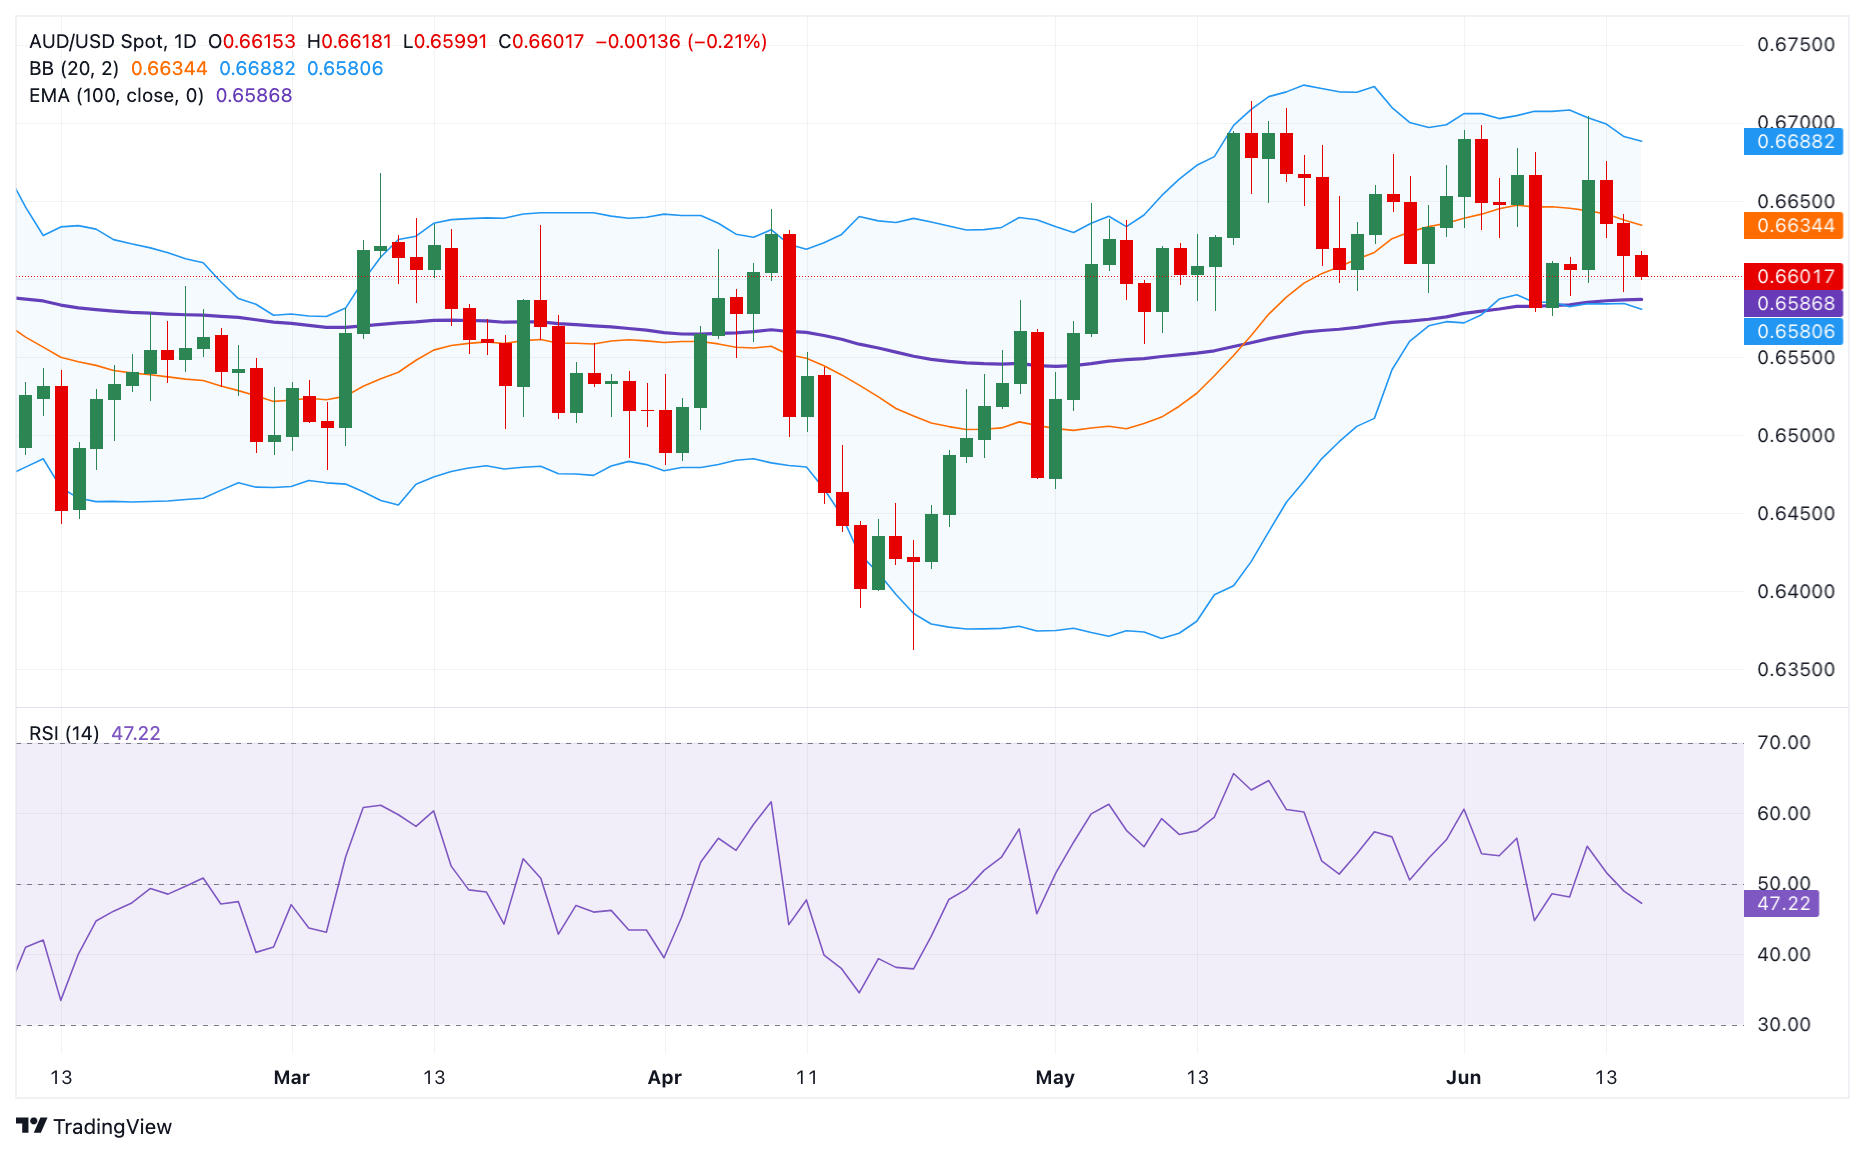
The Australian Dollar trades weaker on the day. The bullish outlook of the AUD/USD pair seems vulnerable as it hovers around the key 100-day Exponential Moving Average (EMA) on the daily chart. The pair could resume its downside journey if it crosses below the key EMA, as mentioned. Additionally, the 14-day Relative Strength Index (RSI) holds below the 50-midline, indicating that further downside cannot be ruled out for the time being.
The key support level for AUD/USD will emerge at the 0.6580-0.6585 region, portraying the confluence of the 100-day EMA and the lower limit of Bollinger Band. A decisive break below this level could see a drop to 0.6510, a low of March 22. The additional downside filter to watch is 0.6465, a low of May 1, and finally, the psychological level and a low of April 17 at 0.6400.
On the upside, the immediate resistance level is seen at 0.6688, the upper boundary of the Bollinger Band. Further north, the next upside target is located at 0.6715, a high of May 16. The next hurdle to watch is 0.6760, a high of January 4.

Australian Dollar price today
The table below shows the percentage change of Australian Dollar (AUD) against listed major currencies today. Australian Dollar was the weakest against the Japanese Yen.
| USD | EUR | GBP | CAD | AUD | JPY | NZD | CHF |
| USD |
| -0.01% | 0.01% | 0.05% | 0.17% | -0.06% | 0.17% | -0.01% |
| EUR | 0.01% |
| 0.02% | 0.06% | 0.19% | -0.03% | 0.17% | -0.01% |
| GBP | -0.01% | 0.00% |
| 0.03% | 0.17% | -0.04% | 0.14% | -0.02% |
| CAD | -0.05% | -0.06% | -0.05% |
| 0.14% | -0.08% | 0.11% | -0.06% |
| AUD | -0.15% | -0.18% | -0.17% | -0.13% |
| -0.22% | -0.02% | -0.20% |
| JPY | 0.04% | 0.03% | 0.03% | 0.11% | 0.21% |
| 0.22% | 0.01% |
| NZD | -0.17% | -0.18% | -0.15% | -0.12% | 0.01% | -0.23% |
| -0.15% |
| CHF | 0.01% | 0.02% | 0.02% | 0.06% | 0.19% | -0.01% | 0.17% |
|
The heat map shows percentage changes of major currencies against each other. The base currency is picked from the left column, while the quote currency is picked from the top row. For example, if you pick the Euro from the left column and move along the horizontal line to the Japanese Yen, the percentage change displayed in the box will represent EUR (base)/JPY (quote).


