tradingkey.logo

EUR/JPY Price Analysis: The key upside barrier emerges above 170.00

FXStreetJun 11, 2024 9:15 AM
  • EUR/JPY attracts some buyers near 169.30 in Wednesday’s early European session, up 0.50% on the day. 
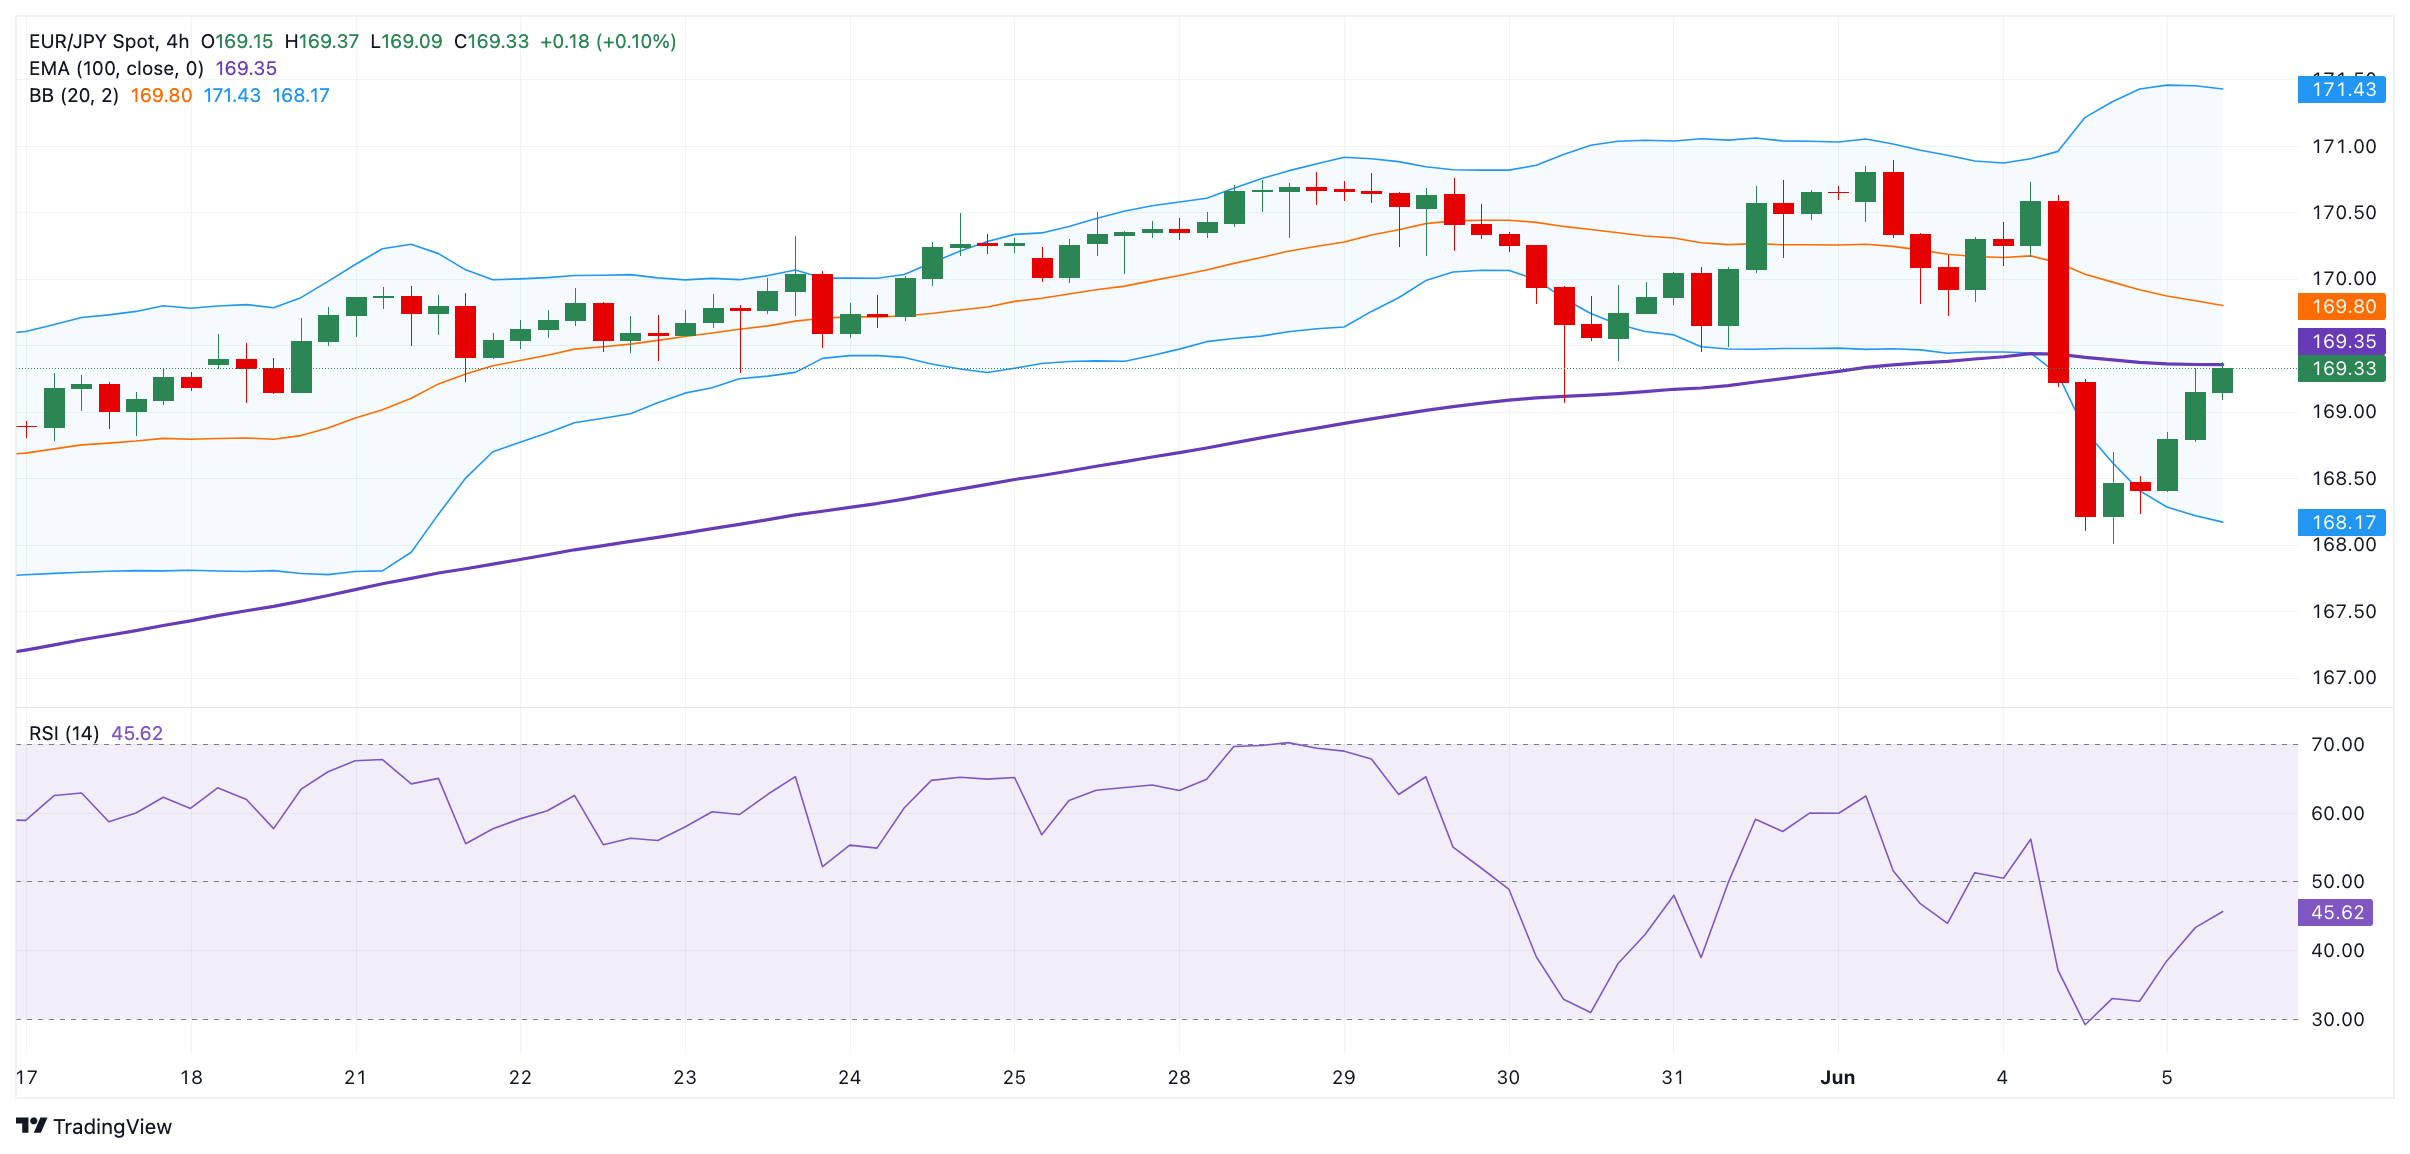
  • The cross keeps the negative picture unchanged below the 100-period EMA, with the bearish RSI on 4-hour chart. 
  • The key upside barrier is seen at the 170.00 psychological level; the initial support level is located at 168.15.


The EUR/JPY cross snaps the two-day losing streak around 169.30 during the early European session on Wednesday. Traders closely watch the European Central Bank (ECB) interest rate decision on Thursday, which is more likely to cut interest rates by 25 basis points (bps). 

Technically, EUR/JPY maintains the bearish outlook as the cross holds below the 100-period Exponential Moving Averages (EMA) on the four-hour chart. The downward momentum is backed by the Relative Strength Index (RSI), which stands in the bearish zone near 44.00, indicating the path of least resistance is to the downside. 

The cross could resume the upside if it can break above the 100-period EMA at 169.35. Further north, the crucial hurdle is seen at the 170.00 psychological round mark. Any follow-through buying will see a rally to a high of June 4 at 170.72 en route to the upper boundary of Bollinger Band at 171.43. 

On the other hand, the initial support level is located near the lower limit of Bollinger Band at 168.15. A breach of the mentioned level could expose a low of May 16 at 167.33. The additional downside filter to watch is a low of May 7 at 165.64. 


EUR/JPY 4-hour chart


Disclaimer: The content of this article solely represents the author's personal opinions and does not reflect the official stance of Tradingkey. It should not be considered as investment advice. The article is intended for reference purposes only, and readers should not base any investment decisions solely on its content. Tradingkey bears no responsibility for any trading outcomes resulting from reliance on this article. Furthermore, Tradingkey cannot guarantee the accuracy of the article's content. Before making any investment decisions, it is advisable to consult an independent financial advisor to fully understand the associated risks.

Related Instruments

Recommended Articles

tradingkey.logo
tradingkey.logo
Intraday Data provided by Refinitiv and subject to terms of use. Historical and current end-of-day data provided by Refinitiv. All quotes are in local exchange time. Real-time last sale data for U.S. stock quotes reflect trades reported through Nasdaq only. Intraday data delayed at least 15 minutes or per exchange requirements.
* References, analysis, and trading strategies are provided by the third-party provider, Trading Central, and the point of view is based on the independent assessment and judgement of the analyst, without considering the investment objectives and financial situation of the investors.
Risk Warning: Our Website and Mobile App provides only general information on certain investment products. Finsights does not provide, and the provision of such information must not be construed as Finsights providing, financial advice or recommendation for any investment product.
Investment products are subject to significant investment risks, including the possible loss of the principal amount invested and may not be suitable for everyone. Past performance of investment products is not indicative of their future performance.
Finsights may allow third party advertisers or affiliates to place or deliver advertisements on our Website or Mobile App or any part thereof and may be compensated by them based on your interaction with the advertisements.
© Copyright: FINSIGHTS MEDIA PTE. LTD. All Rights Reserved.