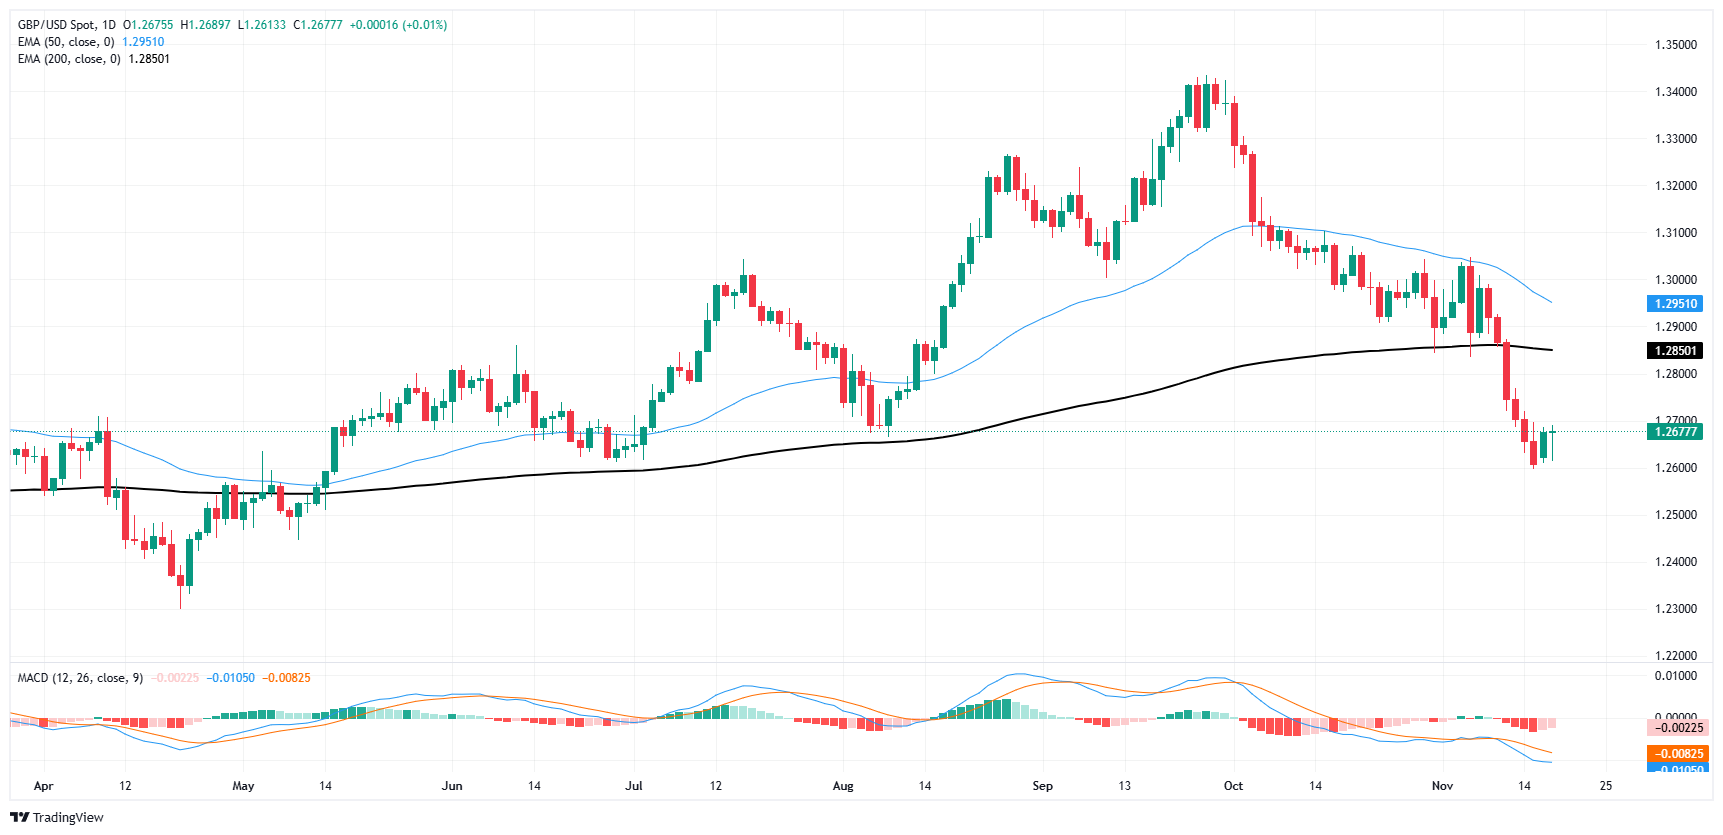
GBP/USD churns below 1.27 ahead of UK CPI inflation print

- GBP/USD spun in circles on Tuesday as BoE gets caught in headlights.
- UK CPI inflation print due on Wednesday alongside hefty data dump.
- US data remains thin, giving Cable traders brief time in the spotlight.
GBP/USD churned chart paper just south of 1.2700 on Tuesday as Cable traders brace for a decently-sized UK data dump due on Wednesday, headlined by UK Consumer Price Index (CPI) inflation figures for October. US economic data takes a reprieve on Wednesday, leaving Cable markets the floorspace to focus on data that might tilt the Bank of England (BoE) toward or away from further rate cuts this year.
The BoE put on a measured stance during its Monetary Policy Report Hearings on Tuesday, noting that interest rates are “moderately restrictive”, causing rate traders to price in less than 20% odds of another rate cut from the UK’s central bank this year.
Headline UK CPI inflation is expected to accelerate to 2.2% YoY in October from 1.7% the month before, while October’s MoM CPI figure is forecast to rise to 0.5% from a flat 0.0%. Core UK CPI inflation is still expected to chill further to 3.1% to 3.2% YoY.
UK Producer Price Index (PPI) business inflation figures are also due on Tuesday, alongside UK Retail Sales numbers, giving GBP traders plenty of data to chew on all at once. US economic data releases remain thin in the front half of the trading week. Mid-tier Initial Jobless Claims are due on Thursday, and expected to show a slight uptick in the number of new unemployment benefits seekers for the week ended November 15. US S&P Purchasing Managers Index (PMI) activity figures will be the number to watch this week, but won’t be dropping on investors until Friday.
GBP/USD price forecast
Despite finding a near-term floor in bids, GBP/USD is still leaning into the bearish camp with price action grappling with chart paper south of the 1.2700 handle, below the 50-day Exponential Moving Average (EMA) near 1.2850. The pair has lost 6.23% top-to-bottom from September’s pean of 1.3434.


