Australian Dollar extends upside as RBA tone shifts more hawkish

- The Australian Dollar (AUD) extends upside in Thursday’s Asian session.
- RBA's hawkish hold and rising bets on Fed rate cut support the pair.
- The US Initial Jobless Claims, Housing data, Philly Fed Manufacturing Index and Fed’s Neel Kashkari speech are due on Thursday.
The Australian Dollar (AUD) trades in positive territory for the third consecutive day on Thursday. The hawkish stance from the Reserve Bank of Australia (RBA) at its June meeting on Tuesday continues to support the pair. Additionally, weaker-than-expected Retail Sales have fueled speculation for US Federal Reserve (Fed) rate cuts later this year, weighing on the Greenback and creating a tailwind for AUD/USD.
However, the RBA statement indicated that the economic outlook remains uncertain and the process of taming inflation to target is unlikely to be smooth. Traders will take more cues from the preliminary Australia’s Judo Bank Purchasing Managers Index (PMI) for May on Friday. Any sign of weakness in the Australian economy might prompt the Australian central bank to lower its borrowing costs, which might drag the AUD lower.
On the US docket, investors will watch the release of the US weekly Initial Jobless Claims, Building Permits, Housing Starts, the Philly Fed Manufacturing Index and the Fed’s Neel Kashkari speech on Thursday. On Friday, the preliminary US S&P Global PMI reports for June will be in the spotlight.
Daily Digest Market Movers: Australian Dollar extends gains, supported by RBA’s hawkish hold
- The Australian central bank delivered a hawkish hold, as widely expected. The RBA kept the cash rate unchanged at 4.35% and reiterated that “the Board is not ruling anything in or out.”
- The RBA Governor Michele Bullock said during the press conference that the board discussed the option of raising rates while the case for a rate cut was not considered, adding that it “will do what is necessary” to return inflation to target.
- The first reading of Australian Judo Bank Manufacturing PMI is projected to improve to 50.6 in June from 49.7 in May.
- Odds of a September Fed funds rate cut rose to 67% after the disappointing retail sales data. Fed funds futures also raise expectations for 50 basis points (bps) of total rate cuts this year.
- The US Initial Jobless Claims for the week ending June 15 are estimated to decline by 235,000 from the previous week's 242,000.
Technical Analysis: AUD/USD remains constructive amid symmetrical triangle pattern
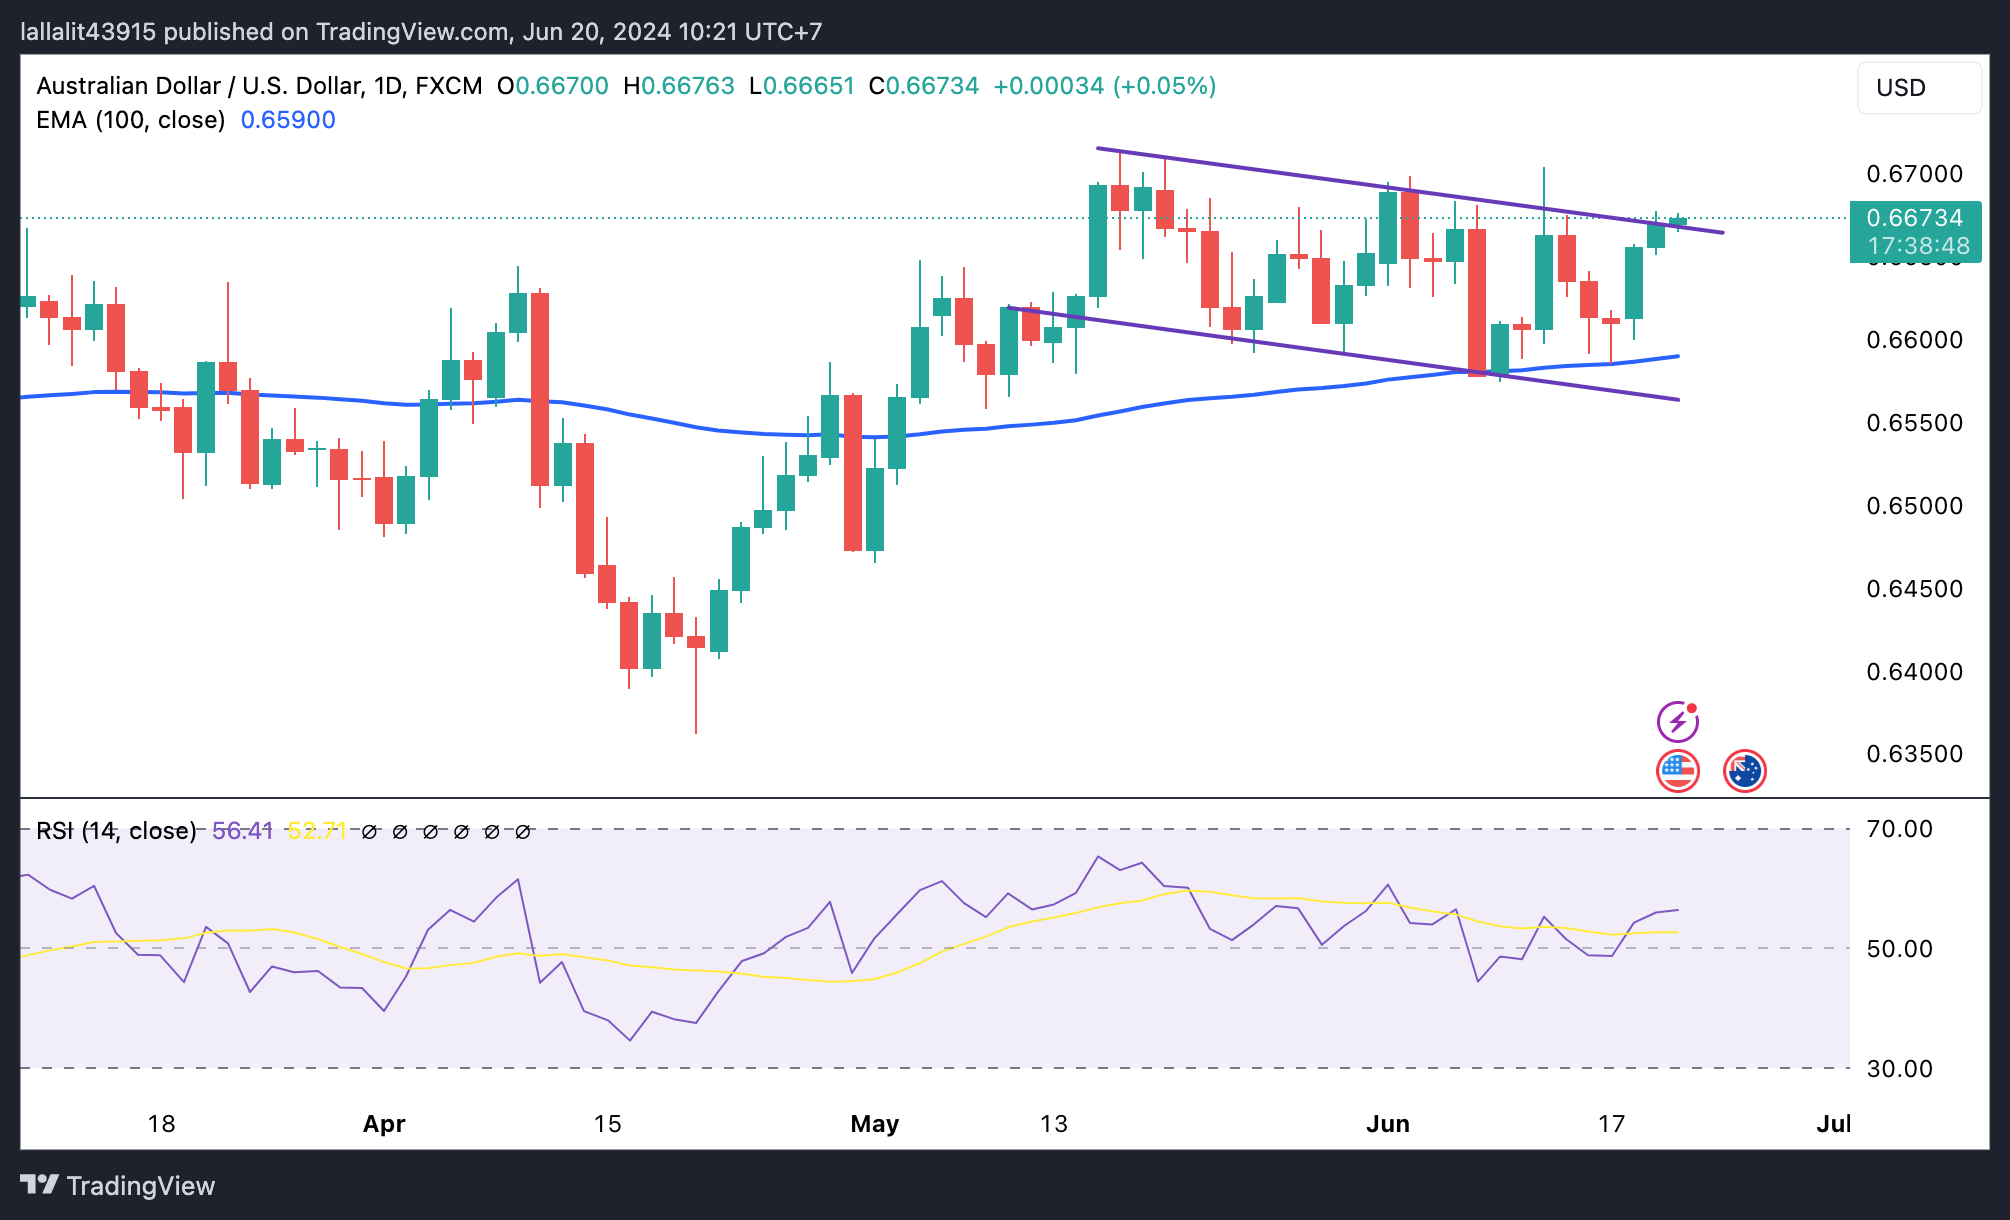
The Australian Dollar trades on a stronger note on Thursday. The AUD/USD pair has established a symmetrical triangle pattern since May 8. The pair keeps the positive vibe beyond the key 100-day Exponential Moving Average (EMA) on the daily chart. The bullish momentum in the 14-day Relative Strength Index (RSI) continues to reinforce the pair’s upside.
A decisive break above the upper boundary of the symmetrical triangle of 0.6670 will attract some buyers to the 0.6700 psychological level. Extended gains will see a rally to 0.6760, a high of January 4.
On the flip side, the 0.6590-0.6600 zone acts as a crucial support level for AUD/USD. The mentioned level is the confluence of the 100-day EMA and the lower limit of triangle patterns. A breach of this level will expose 0.6510, a low of March 22, followed by 0.6465, a low of May 1.

Australian Dollar price today
The table below shows the percentage change of Australian Dollar (AUD) against listed major currencies today. Australian Dollar was the strongest against the Pound Sterling.
| USD | EUR | GBP | CAD | AUD | JPY | NZD | CHF |
| USD |
| 0.00% | 0.00% | 0.00% | 0.00% | 0.00% | 0.12% | 0.00% |
| EUR | -0.06% |
| -0.03% | -0.01% | 0.04% | -0.03% | 0.06% | -0.01% |
| GBP | -0.01% | 0.00% |
| 0.01% | 0.02% | 0.00% | -0.03% | 0.01% |
| CAD | 0.00% | 0.00% | 0.00% |
| 0.02% | -0.01% | -0.03% | 0.00% |
| AUD | 0.01% | 0.02% | 0.02% | 0.01% |
| 0.00% | -0.01% | 0.01% |
| JPY | 0.00% | 0.00% | 0.01% | -0.01% | 0.03% |
| -0.01% | 0.03% |
| NZD | 0.02% | 0.03% | 0.04% | 0.03% | 0.05% | 0.05% |
| 0.02% |
| CHF | 0.02% | -0.01% | -0.01% | 0.00% | 0.02% | -0.03% | -0.03% |
|
The heat map shows percentage changes of major currencies against each other. The base currency is picked from the left column, while the quote currency is picked from the top row. For example, if you pick the Euro from the left column and move along the horizontal line to the Japanese Yen, the percentage change displayed in the box will represent EUR (base)/JPY (quote).


