tradingkey.logo

NZD/JPY Price Analysis: Selling pressure intensifies, 20-day SMA under attack

FXStreetNov 5, 2024 12:22 AM

  • NZD/JPY extended its decline on Monday, dropping to 90.90.
  • Technical indicators suggest a bearish outlook, with increasing selling pressure and a declining RSI.
  • The 20-day SMA is the last barrier against the sellers.


The NZD/JPY’s recent sideways movement seems to be ending, as the pair resumed its decline and fell slightly below the 20-day Simple Moving Average (SMA), below 91.00 on Monday. 

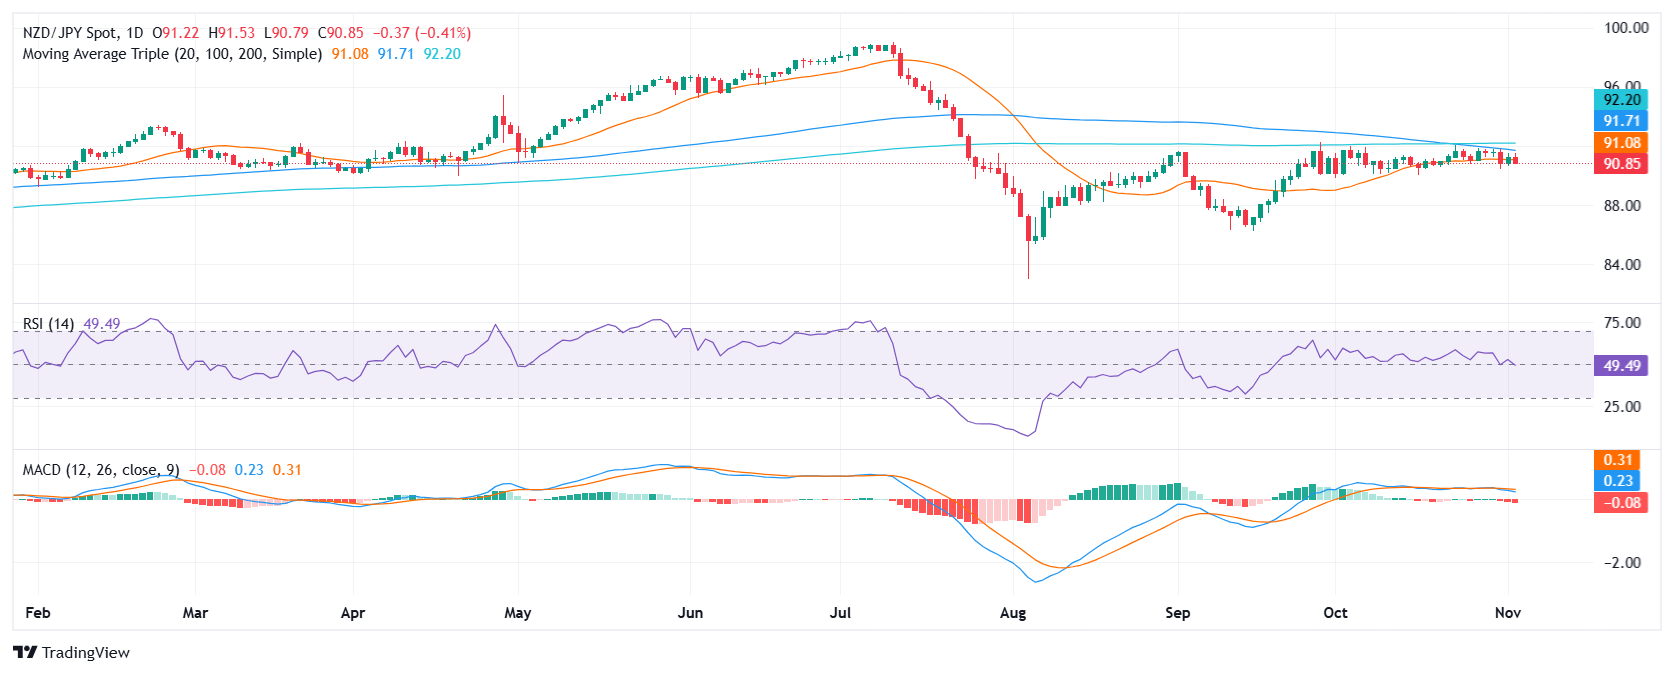
The Moving Average Convergence Divergence (MACD) indicator shows rising red bars, indicating increasing bearish momentum while the Relative Strength Index (RSI) is below 50, with a declining slope, also suggesting a bearish outlook.

The selling pressure is likely to continue, with potential support levels at 90.50, 90.00, and 89.50. If the pair breaks below 90.50, it could signal further decline. On the other hand, a close above 91.50 resistance could indicate a trend reversal. However, the overall outlook remains bearish, as the MACD and RSI indicators suggest strong selling pressure. In addition, the 100-day SMA is looming near the 20-day average and in case of completing a bearish crossover more selling pressure should be expected.

NZD/JPY daily chart

Disclaimer: The content of this article solely represents the author's personal opinions and does not reflect the official stance of Tradingkey. It should not be considered as investment advice. The article is intended for reference purposes only, and readers should not base any investment decisions solely on its content. Tradingkey bears no responsibility for any trading outcomes resulting from reliance on this article. Furthermore, Tradingkey cannot guarantee the accuracy of the article's content. Before making any investment decisions, it is advisable to consult an independent financial advisor to fully understand the associated risks.

Related Instruments

Recommended Articles

tradingkey.logo
tradingkey.logo
Intraday Data provided by Refinitiv and subject to terms of use. Historical and current end-of-day data provided by Refinitiv. All quotes are in local exchange time. Real-time last sale data for U.S. stock quotes reflect trades reported through Nasdaq only. Intraday data delayed at least 15 minutes or per exchange requirements.
* References, analysis, and trading strategies are provided by the third-party provider, Trading Central, and the point of view is based on the independent assessment and judgement of the analyst, without considering the investment objectives and financial situation of the investors.
Risk Warning: Our Website and Mobile App provides only general information on certain investment products. Finsights does not provide, and the provision of such information must not be construed as Finsights providing, financial advice or recommendation for any investment product.
Investment products are subject to significant investment risks, including the possible loss of the principal amount invested and may not be suitable for everyone. Past performance of investment products is not indicative of their future performance.
Finsights may allow third party advertisers or affiliates to place or deliver advertisements on our Website or Mobile App or any part thereof and may be compensated by them based on your interaction with the advertisements.
© Copyright: FINSIGHTS MEDIA PTE. LTD. All Rights Reserved.