EUR/USD edges lower after US CPI data, ECB’s decision looms

- EUR/USD dips after US Core CPI rises 0.3% MoM, reinforcing Fed rate cut expectations of 25 bps.
- ECB expected to cut rates by 25 bps this week amid slowing EU economic data and Germany’s inflation drop to 1.9% YoY.
- ECB’s post-September monetary policy decisions could become more complex as inflation components remain sticky.
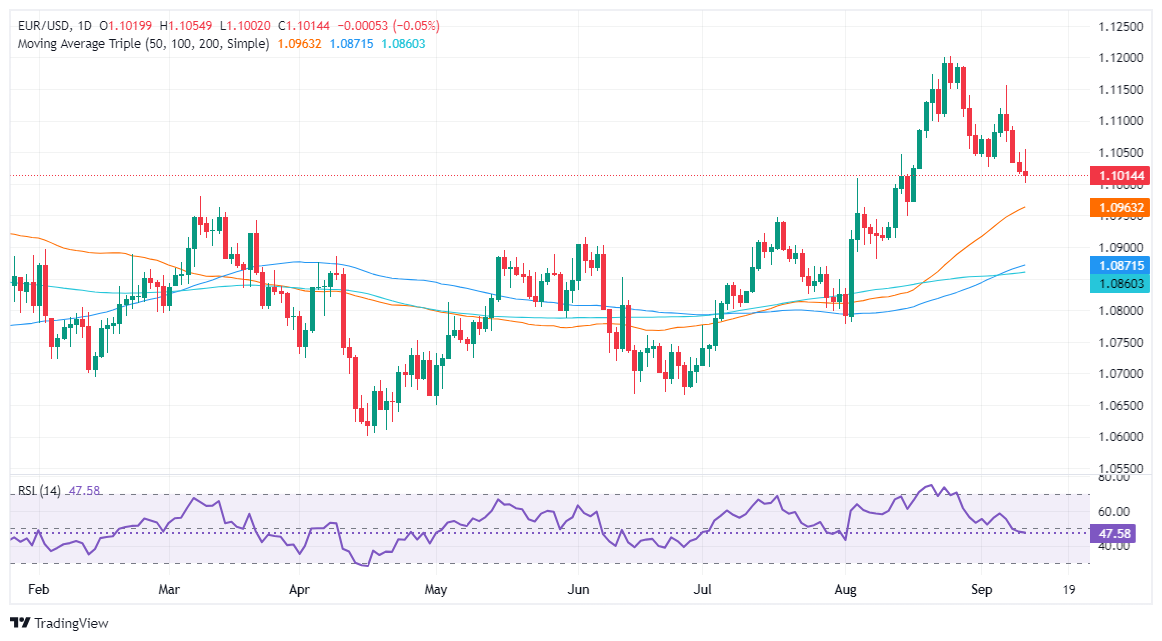
The Euro is set to end Wednesday’s session with minuscule losses against the Greenback, dropping 0.04% after the latest US inflation report showed that the core Consumer Price Index (CPI) stalled in August. The EUR/USD trades at 1.1014 after hitting a daily high of 1.1055.
EUR/USD slips as traders await ECB's upcoming rate decision
Wall Street ended the session on the front foot, while the Greenback finished firm on the back of an uptick in the US Core Consumer Price Index (CPI). August’s Core CPI rose 0.3%, MoM, up from 0.2% in the previous month, exceeding estimates. The rest of the inflation figures, namely headlines in annual and monthly statistics and yearly core CPI, were aligned with estimates.
The EUR/USD decline was capped by the European Central Bank (ECB) monetary policy decision looming, as the pair touched a daily low of 1.1001, bouncing immediately toward the 1.1010-1.1020 area.
Another reason that weighed on the EUR/USD was that money market futures traders trimmed their bets for a 50 basis points (bps) Fed rate cut next week, from around 40% to 15%, while 25 bps increased from 66% to 85%.
The Eurozone (EU) economic docket will feature the ECB’s decision ahead of the week. The ECB is expected to cut rates by 25 bps after Germany’s inflation hit 1.9% YoY, while PMI readings suggest an ongoing economic slowdown. Despite that, ECB hawks are expected to push back as some inflation components are stickier than expected.
Regarding forward guidance, sources cited by Reuters noted that the ECB’s monetary policy decisions after September would be more complicated.
Across the pond, the US economic docket will feature the release of the latest Initial Jobless Claims report for the week ending September 7, along with the release of the Producer Price Index (PPI).
EUR/USD Price Forecast: Technical outlook
The EUR/USD is neutrally biased, though it remains above the 1.1000 figure, which is ahead of the ECB’s decision. The momentum shifted to bearish, as seen in the Relative Strength Index (RSI), though its slope aims upward.
If the EUR/USD rallies past the September 11 peak at 1.1054, that would sponsor a move to the 1.1100 mark. Conversely, if the pair tumbles below 1.1000, the bulls’ first line of defense would be the 50-day moving average (DMA) at 1.0967, followed by the July 17 swing high turned support at 1.0948.

Euro PRICE Today
The table below shows the percentage change of Euro (EUR) against listed major currencies today. Euro was the strongest against the US Dollar.
| USD | EUR | GBP | JPY | CAD | AUD | NZD | CHF |
|---|---|---|---|---|---|---|---|---|
USD |
| -0.02% | -0.01% | -0.09% | -0.03% | -0.03% | 0.00% | -0.03% |
EUR | 0.02% |
| 0.00% | -0.05% | 0.00% | -0.01% | 0.02% | -0.02% |
GBP | 0.01% | -0.00% |
| 0.00% | -0.00% | -0.02% | 0.01% | -0.02% |
JPY | 0.09% | 0.05% | 0.00% |
| 0.03% | 0.02% | 0.02% | 0.02% |
CAD | 0.03% | -0.01% | 0.00% | -0.03% |
| 0.00% | 0.01% | -0.02% |
AUD | 0.03% | 0.01% | 0.02% | -0.02% | -0.00% |
| 0.03% | 0.01% |
NZD | -0.00% | -0.02% | -0.01% | -0.02% | -0.01% | -0.03% |
| -0.05% |
CHF | 0.03% | 0.02% | 0.02% | -0.02% | 0.02% | -0.01% | 0.05% |
|
The heat map shows percentage changes of major currencies against each other. The base currency is picked from the left column, while the quote currency is picked from the top row. For example, if you pick the Euro from the left column and move along the horizontal line to the US Dollar, the percentage change displayed in the box will represent EUR (base)/USD (quote).


