EUR/USD trapped below 1.09 as quiet Monday markets churn

- EUR/USD continued to drift near 1.0900 after a quiet start to the new trading week.
- The Euro is poised for a rebound after paring back gains against the US Dollar.
- Key data due later in the week, data-light sessions expected until then.
EUR/USD churned on Monday just below 1.0900 as the new trading week kicks things off on a notably light note. Meaningful data remains limited for the first half of the trading week, leaving Fiber traders to shuffle in place as investors await Wednesday’s key Purchasing Managers Index (PMI) figures for both the EU and the US.
Forex Today: Key US data prompt some caution
Monday and Tuesday are set to keep things roughly on-balance as markets await a kickstart to the week’s meaningful economic data calendar on Wednesday. On Tuesday, mid-tier US Existing Home Sales Change for June will be released. EUR/USD traders will be focusing on Wednesday’s double-header of Purchasing Managers Index (PMI) data prints. The EU’s Manufacturing and Services PMI for July are expected to slightly increase, with MoM Services PMI numbers projected to be at 53.0 compared to the previous month’s 52.8.
On Wednesday, the US will release its own PMI data. Forecasting models predict that July’s US Services PMI will decrease to 54.4 from the previous 55.3. Thursday will continue with high-impact US data trend, featuring annualized Gross Domestic Product (GDP) for the second quarter of 2024. The trading week will conclude with Friday’s US Personal Consumption Expenditure - Price Index (PCE) inflation, which will provide key US inflation data.
Euro PRICE This week
The table below shows the percentage change of Euro (EUR) against listed major currencies this week. Euro was the strongest against the Australian Dollar.
| USD | EUR | GBP | JPY | CAD | AUD | NZD | CHF |
|---|---|---|---|---|---|---|---|---|
USD |
| -0.06% | -0.14% | -0.31% | 0.32% | 0.69% | 0.64% | 0.20% |
EUR | 0.06% |
| -0.09% | -0.29% | 0.34% | 0.79% | 0.65% | 0.20% |
GBP | 0.14% | 0.09% |
| -0.30% | 0.42% | 0.89% | 0.72% | 0.27% |
JPY | 0.31% | 0.29% | 0.30% |
| 0.67% | 1.08% | 0.92% | 0.46% |
CAD | -0.32% | -0.34% | -0.42% | -0.67% |
| 0.46% | 0.32% | -0.12% |
AUD | -0.69% | -0.79% | -0.89% | -1.08% | -0.46% |
| -0.14% | -0.60% |
NZD | -0.64% | -0.65% | -0.72% | -0.92% | -0.32% | 0.14% |
| -0.41% |
CHF | -0.20% | -0.20% | -0.27% | -0.46% | 0.12% | 0.60% | 0.41% |
|
The heat map shows percentage changes of major currencies against each other. The base currency is picked from the left column, while the quote currency is picked from the top row. For example, if you pick the Euro from the left column and move along the horizontal line to the US Dollar, the percentage change displayed in the box will represent EUR (base)/USD (quote).
EUR/USD technical outlook
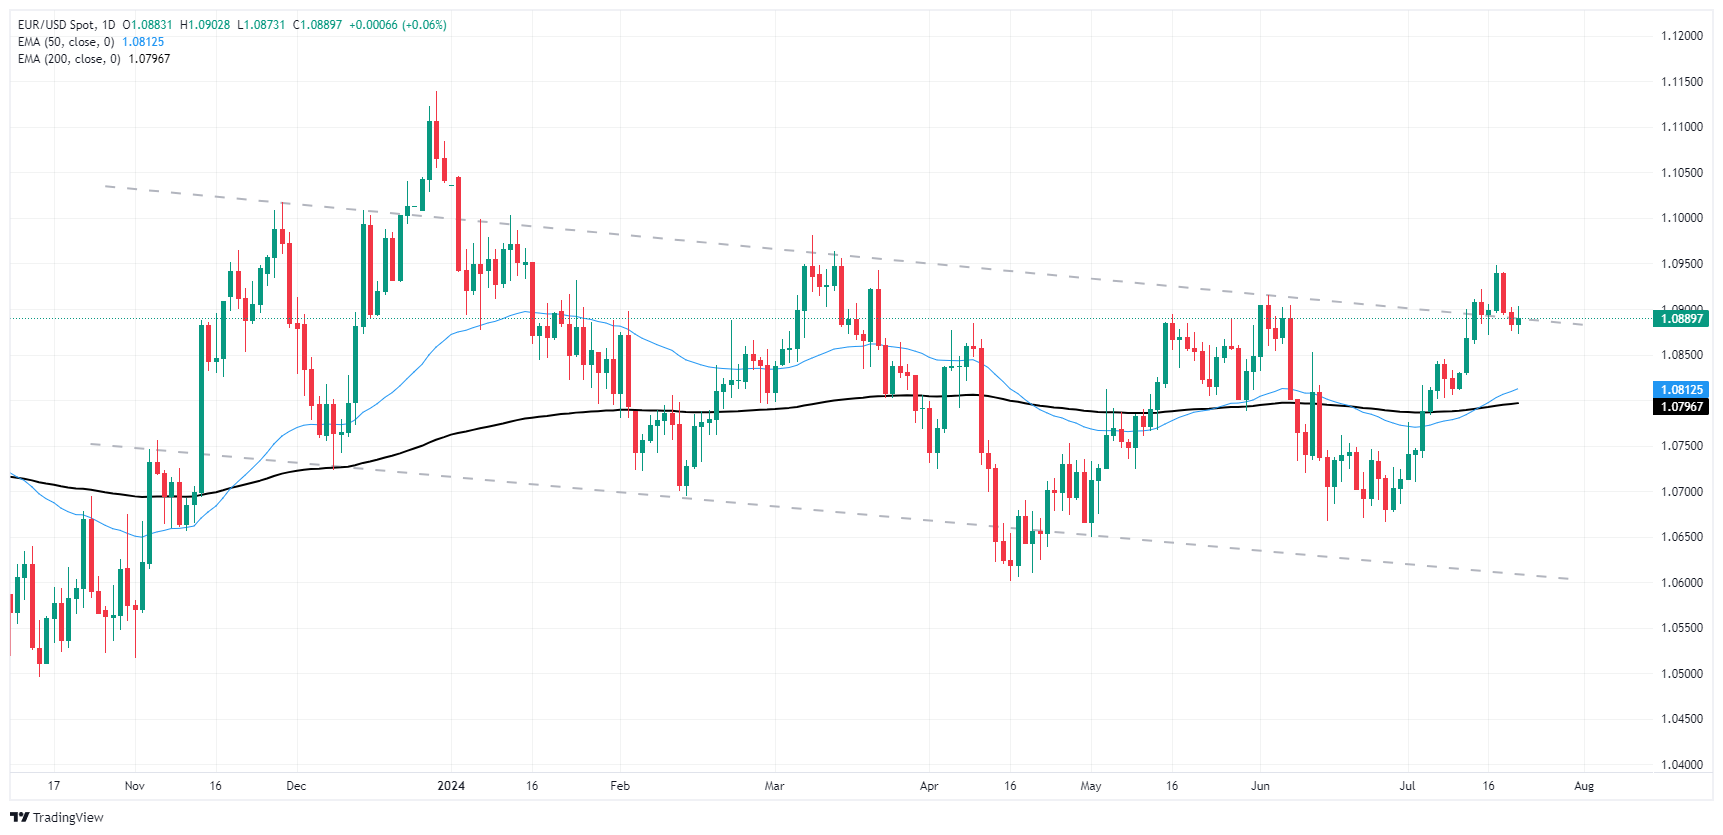
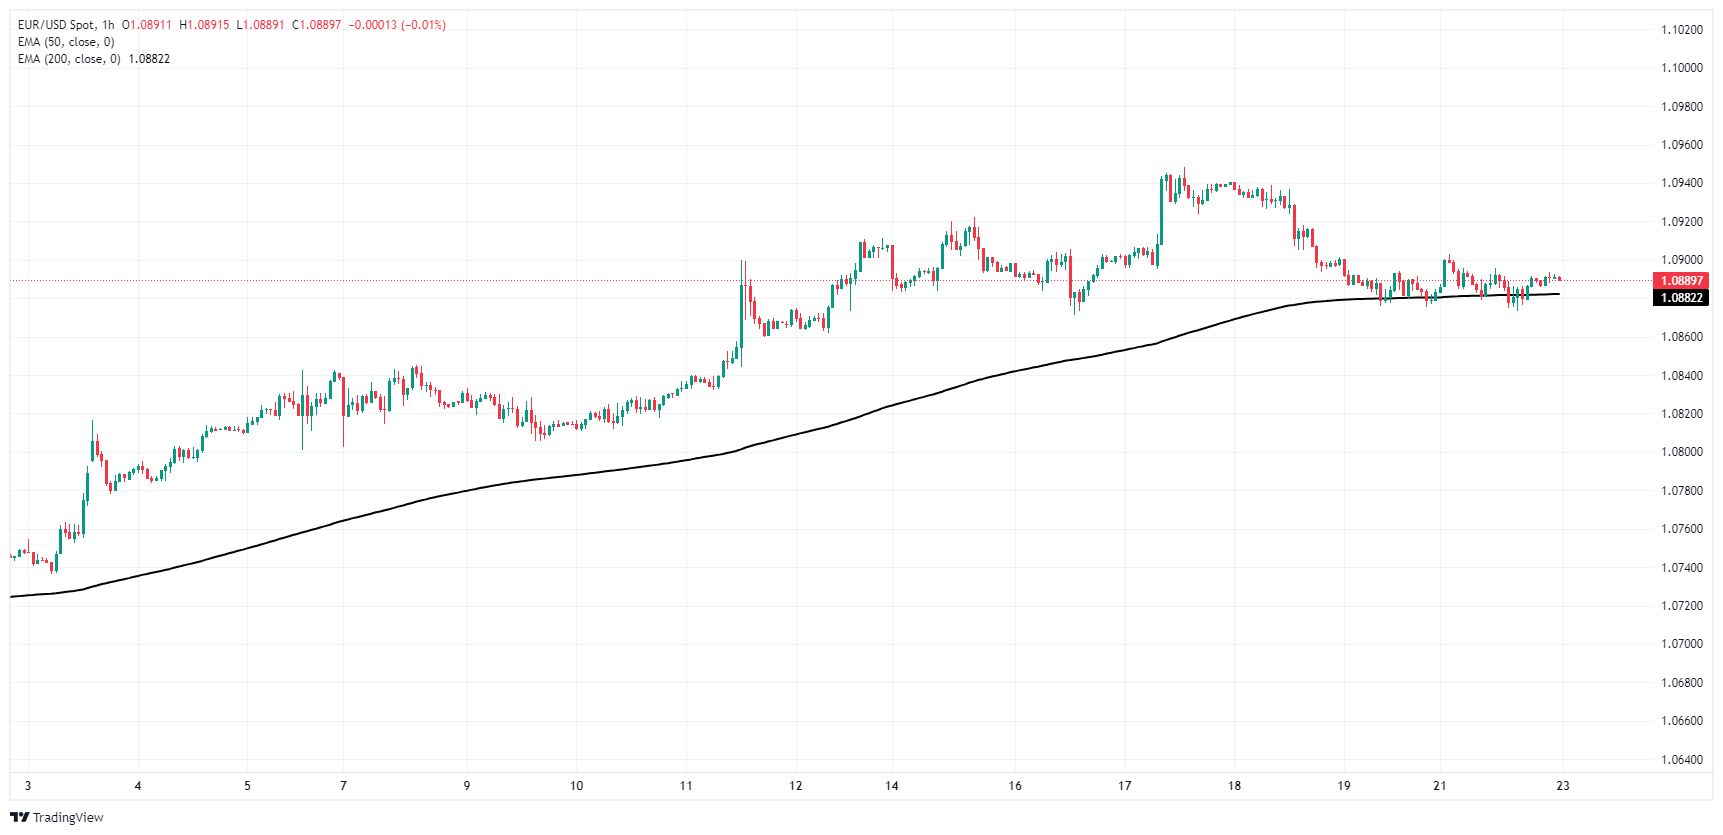
EUR/USD traded tightly with near-term technical levels on Monday, cycling just north of the 200-hour Exponential Moving Average (EMA) at 1.0882. The Fiber has pulled back from recent highs set just shy of 1.0950 as Greenback bidding eases further back but the top end remains close by.
Daily candlesticks are poised for an extended backslide as price action slips back into the range of a rough descending channel, and a continued bearish reversal could see bids set up to challenge the 200-day EMA at 1.0795.
EUR/USD hourly chart
EUR/USD daily chart
