XRP Could Start An Explosive Move To $33 Within 28 Days, Says Analyst

Crypto analyst EGRAG CRYPTO (@egragcrypto) has released a chart update that could stir excitement among XRP holders. In his latest post on X, the analyst references historical price behavior, a potential channel formation, and precise technical indicators to suggest that XRP may be on the verge of a swift move toward the $27-$33 price range. The timeframe for this potential surge, according to his analysis, could be as short as 28 days if conditions mirror XRP’s 2017 bull run.
XRP Price To Hit $33?
Egrag opens his post by acknowledging the risk and difficulty of making time-based forecasts. “Sometimes, I throw myself under the bus with time predictions, but honestly, it’s worth sharing with the community! Even though I know it might backfire, I still give it a shot,” he writes. He also reiterates his broader philosophy: “Now, let me be clear—I never try to time the market because it’s nearly impossible. Instead, I follow the golden rule: ‘Time in the market is more important than timing the market!’” This balance between caution and optimism underscores the delicate nature of technical analyses in unpredictable cryptocurrency markets.
The centerpiece of Egrag’s analysis is a potential weekly channel that he believes strongly resembles the price structure XRP exhibited in 2017. He points out that, during that period, the cycle leading from the channel’s inception to the final breakout lasted approximately 175 days. Within that timespan, the token recorded a rise of about 2,500% from the lower boundary of the channel. That surge culminated in a cycle “blow-off top,” a term used by traders to describe a rapid price climb followed by an even quicker reversal.
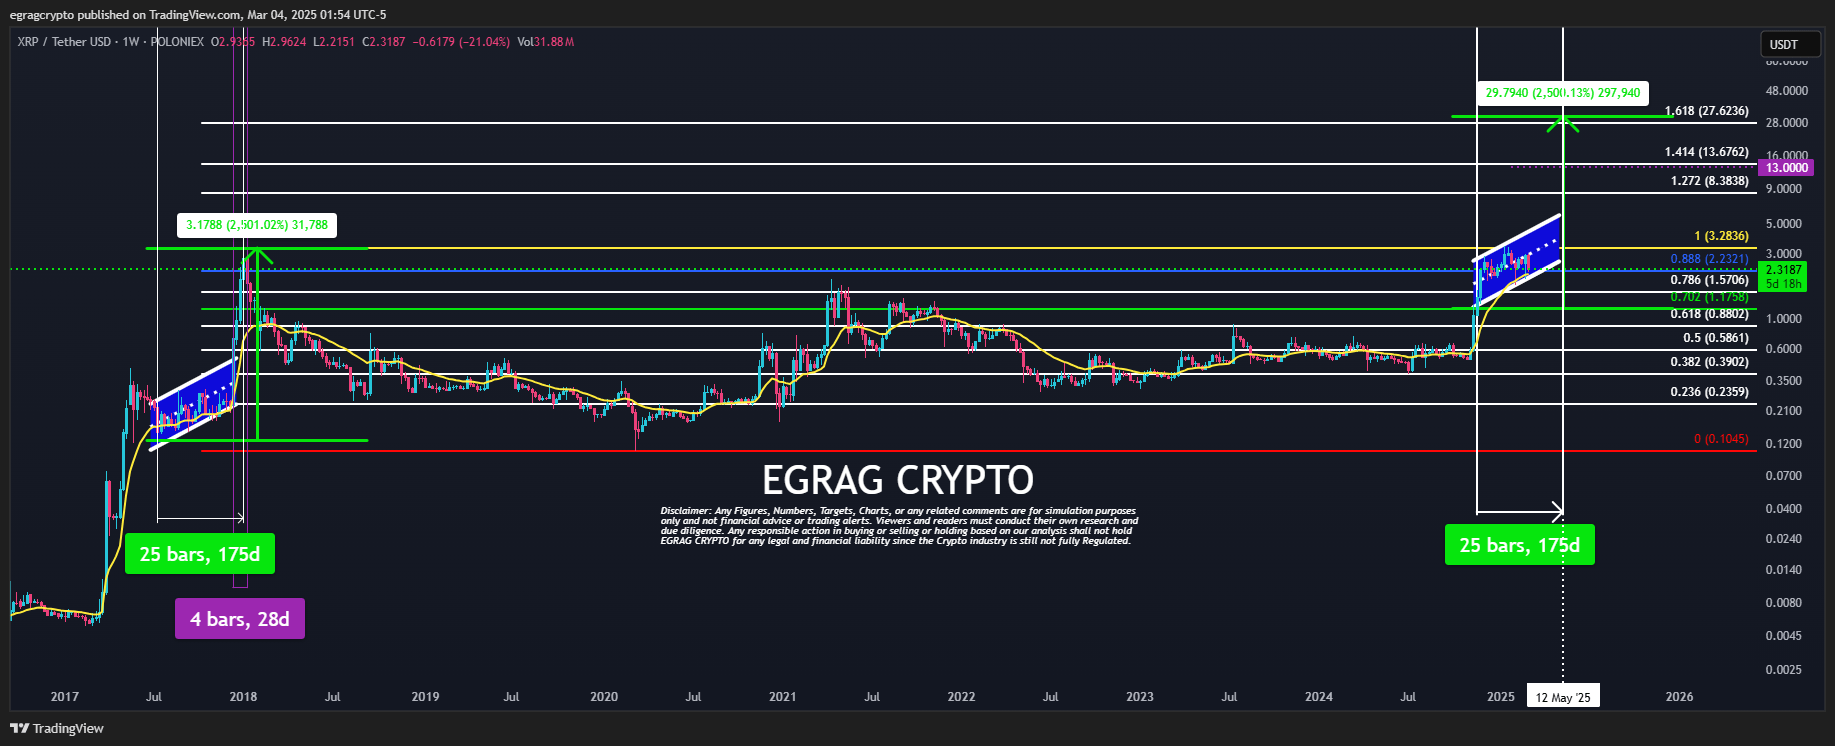
According to Egrag, these chart features appear to be resurfacing now, with XRP showing signs of maintaining support above the 21-week Exponential Moving Average (EMA). “We’re seeing similar XRP price action today, with the 21 EMA closing above and only a minor wick,” he notes, suggesting that the token’s price is finding strength near a well-watched moving average. Such support, if sustained, can be an early indicator that bullish momentum is building.
One of the most eye-catching points in Egrag’s chart is his projection that XRP could climb toward the Fib 1.618 extension level, where he places a tentative target between $27 and $33. He explains that, if 2017’s channel pattern truly echoes today’s structure, XRP may replicate a similar percentage gain and time duration before hitting that upper range. “If we apply this same pattern to the current market, XRP could surge to the Fib 1.618 level, targeting $27-$33!” he writes. He further suggests that this parabolic move “could happen within just 28 days,” based on his historical observations.
Before reaching this high, XRP could first target the Fib 1.272 level at $8.38, followed by the Fib 1.414 level at $13.67. These are historically relevant Fibonacci extension points that traders often monitor as price advances in an uptrend.
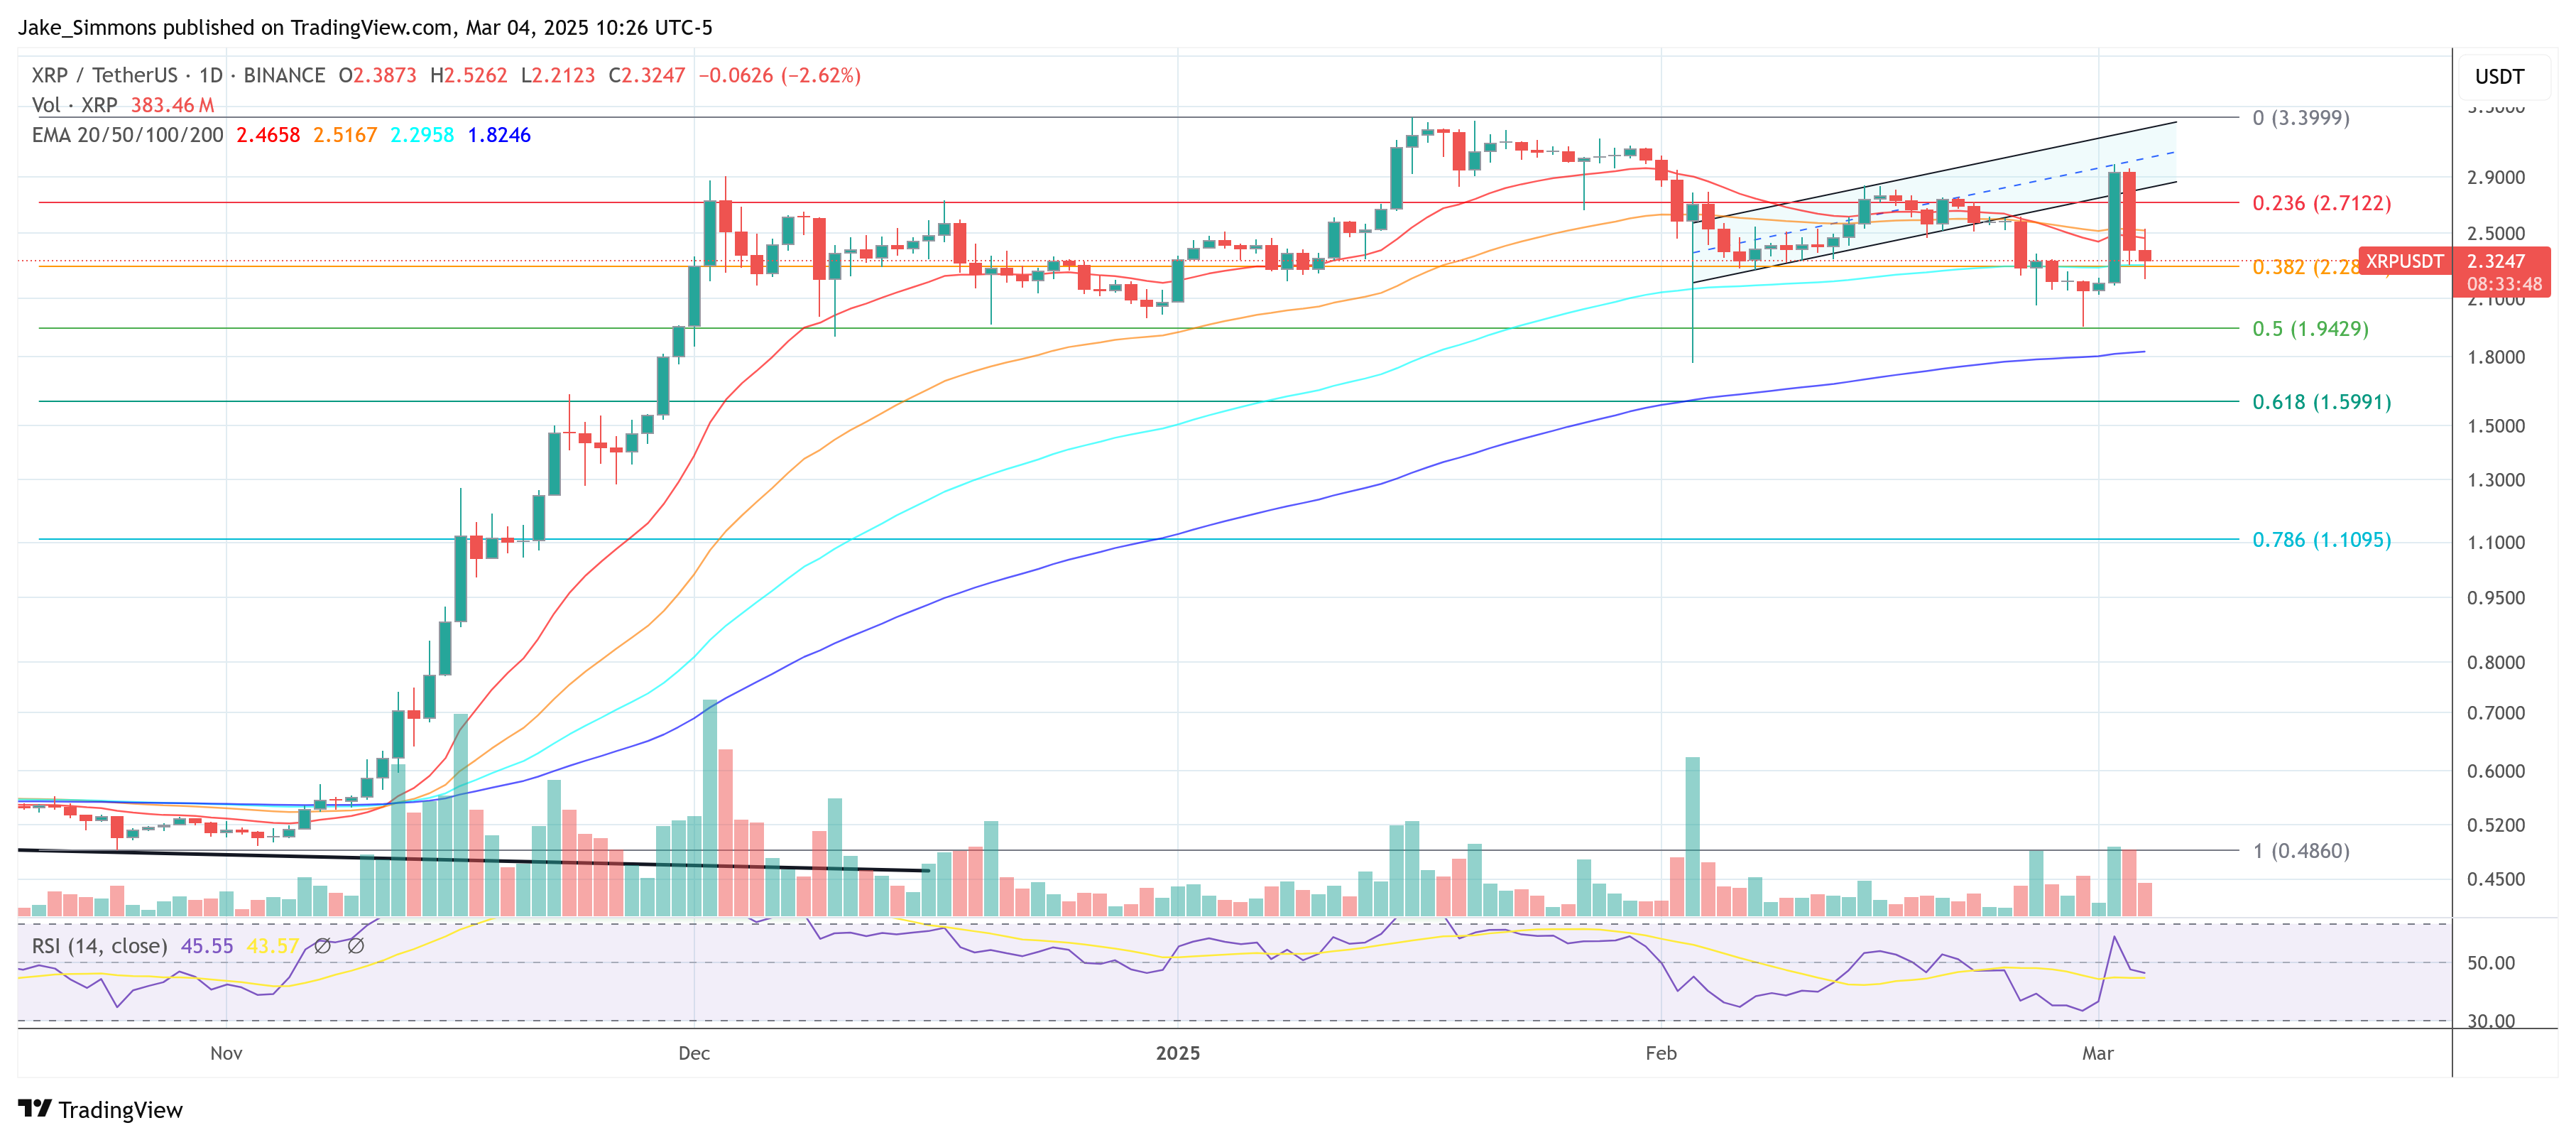
In the immediate short term, XRP is currently positioned at the 0.888 Fibonacci retracement level ($2.23), with additional support at the 0.786 level ($1.57) and 0.702 level ($1.78). These levels suggest that XRP is consolidating within a structured Fibonacci-based pattern before an anticipated breakout.
This 28-day forecast is arguably the most striking part of his analysis, reflecting a break from his usual reluctance to pin down short-term timelines. Egrag concedes that timing market moves is notoriously challenging but remains confident that reviewing past cycles can still offer valuable insights. “Even though I know it might backfire, I still give it a shot,” he remarks, acknowledging the inherent volatility and unpredictability of crypto assets.
At press time, XRP traded at $2.32.