XRP Indicator Reliable Since 2022 Now Gives This Signal

An analyst has pointed out how the Tom Demark (TD) Sequential has once again formed a signal on the 2-week price chart of XRP.
XRP Has Seen A New TD Sequential Signal Recently
In a new post on X, analyst Ali Martinez has talked about the TD Sequential for the biweekly XRP price. The “TD Sequential” refers to an indicator from technical analysis (TA) that’s used for finding probable locations of reversal in any asset’s chart.
The indicator involves two phases: setup and countdown. In the first of these, the setup, candles of the same color are counted up to nine (note that they don’t have to be one after the other). Once these nine candles are in, the setup is said to be complete and the asset could be assumed to have arrived at a potential turnaround.
As soon as the setup is over, the countdown kicks off. In this second phase, candles are once again counted up, except this time the count goes on until thirteen. Following these candles, the price reaches another likely point of reversal.
XRP has recently formed a TD Sequential reversal signal in its two-week chart. Here is the chart shared by Martinez, that shows this pattern forming for the asset:
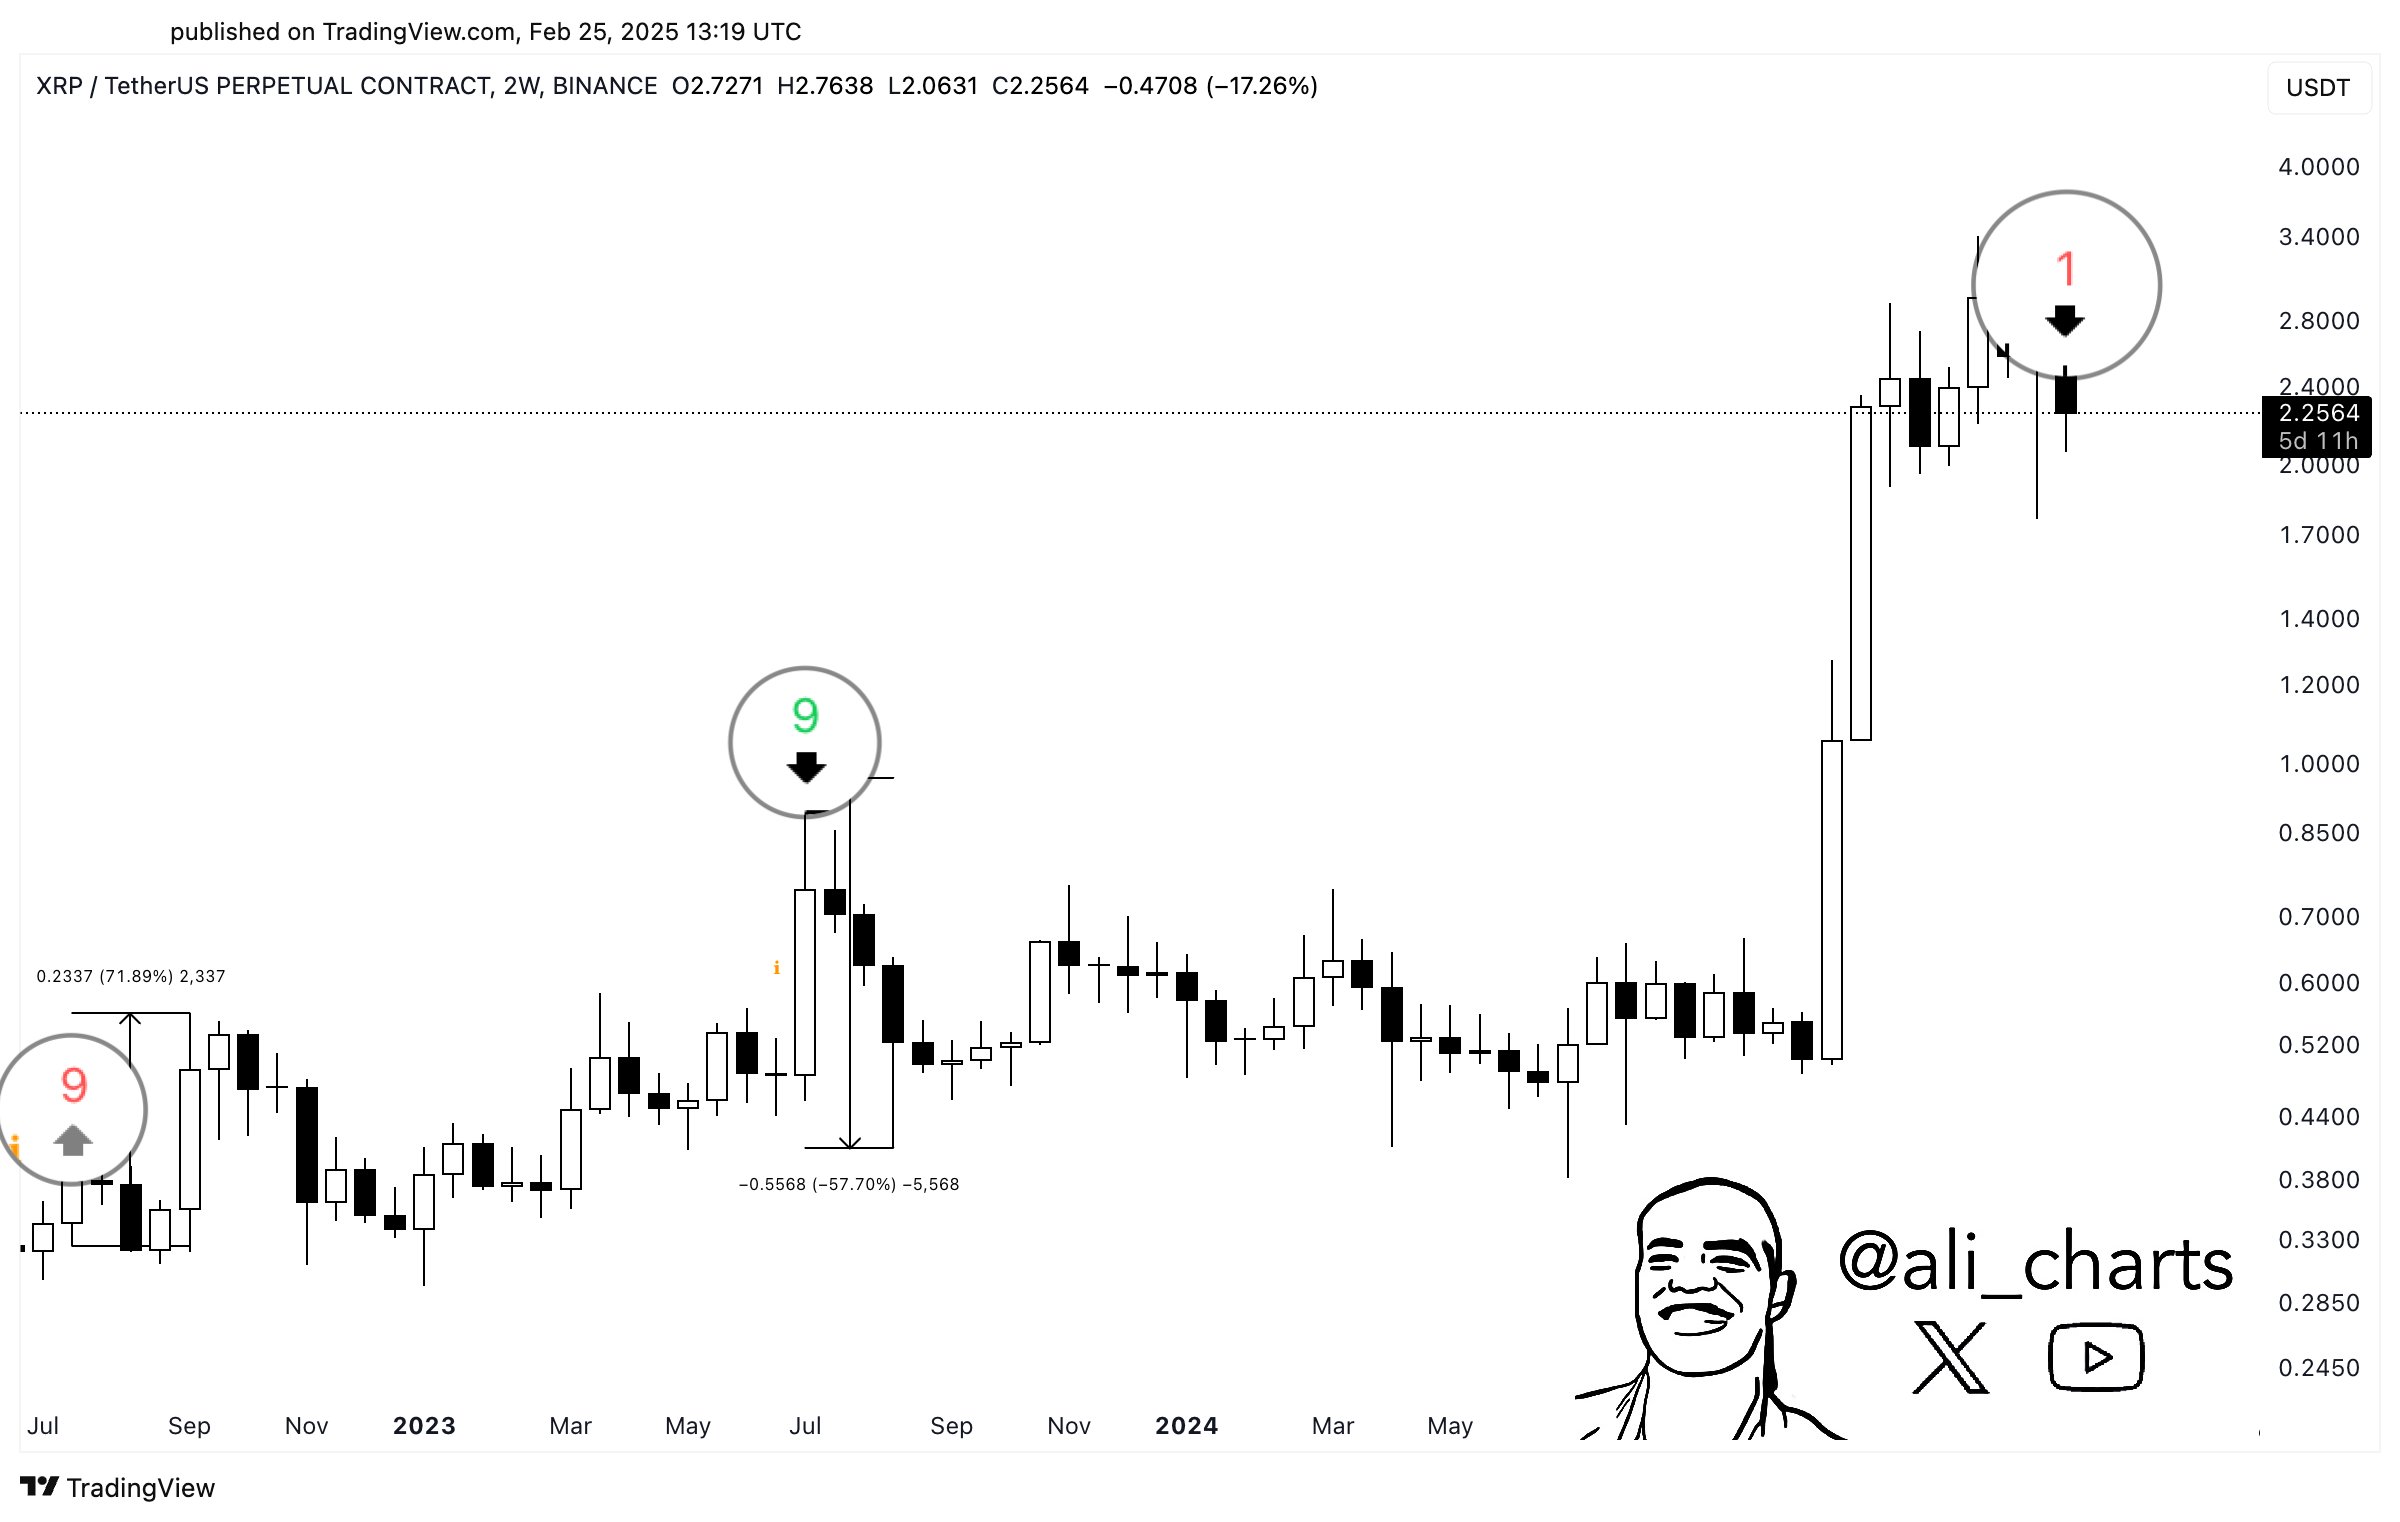
As is visible in the above graph, XRP has formed this TD Sequential signal with green candles, meaning the cryptocurrency could have just witnessed a reversal to the downside.
In the chart, the analyst has also highlighted the previous signals that the asset has seen in this indicator during the last couple of years. “The TD Sequential indicator has been highly accurate in predicting XRP price direction since 2022,” notes Martinez.
It appears that the pattern may be holding for the cryptocurrency this time as well, as its price has been going down since the signal in the TD Sequential has emerged.
In an X post from yesterday, the analyst discussed about how the coin was looking to break under an Ascending Channel. The “Ascending Channel” is a TA pattern that forms when an asset’s price observes overall consolidation toward the upside inside a channel between two parallel trendlines that are slopped upward.

Generally, breaks that happen below the lower trendline of an Ascending Channel lead to a bearish outcome for the asset. When sharing the chart yesterday, Martinez had said the coin was targeting $1.65.
It now remains to be seen whether XRP’s correction would stretch this far or not.
XRP Price
At the time of writing, XRP is trading around $2.22, down more than 15% over the last week.